
MATLAB: An Introduction with Applications
6th Edition
ISBN: 9781119256830
Author: Amos Gilat
Publisher: John Wiley & Sons Inc
expand_more
expand_more
format_list_bulleted
Related questions
Question
thumb_up100%

Transcribed Image Text:R
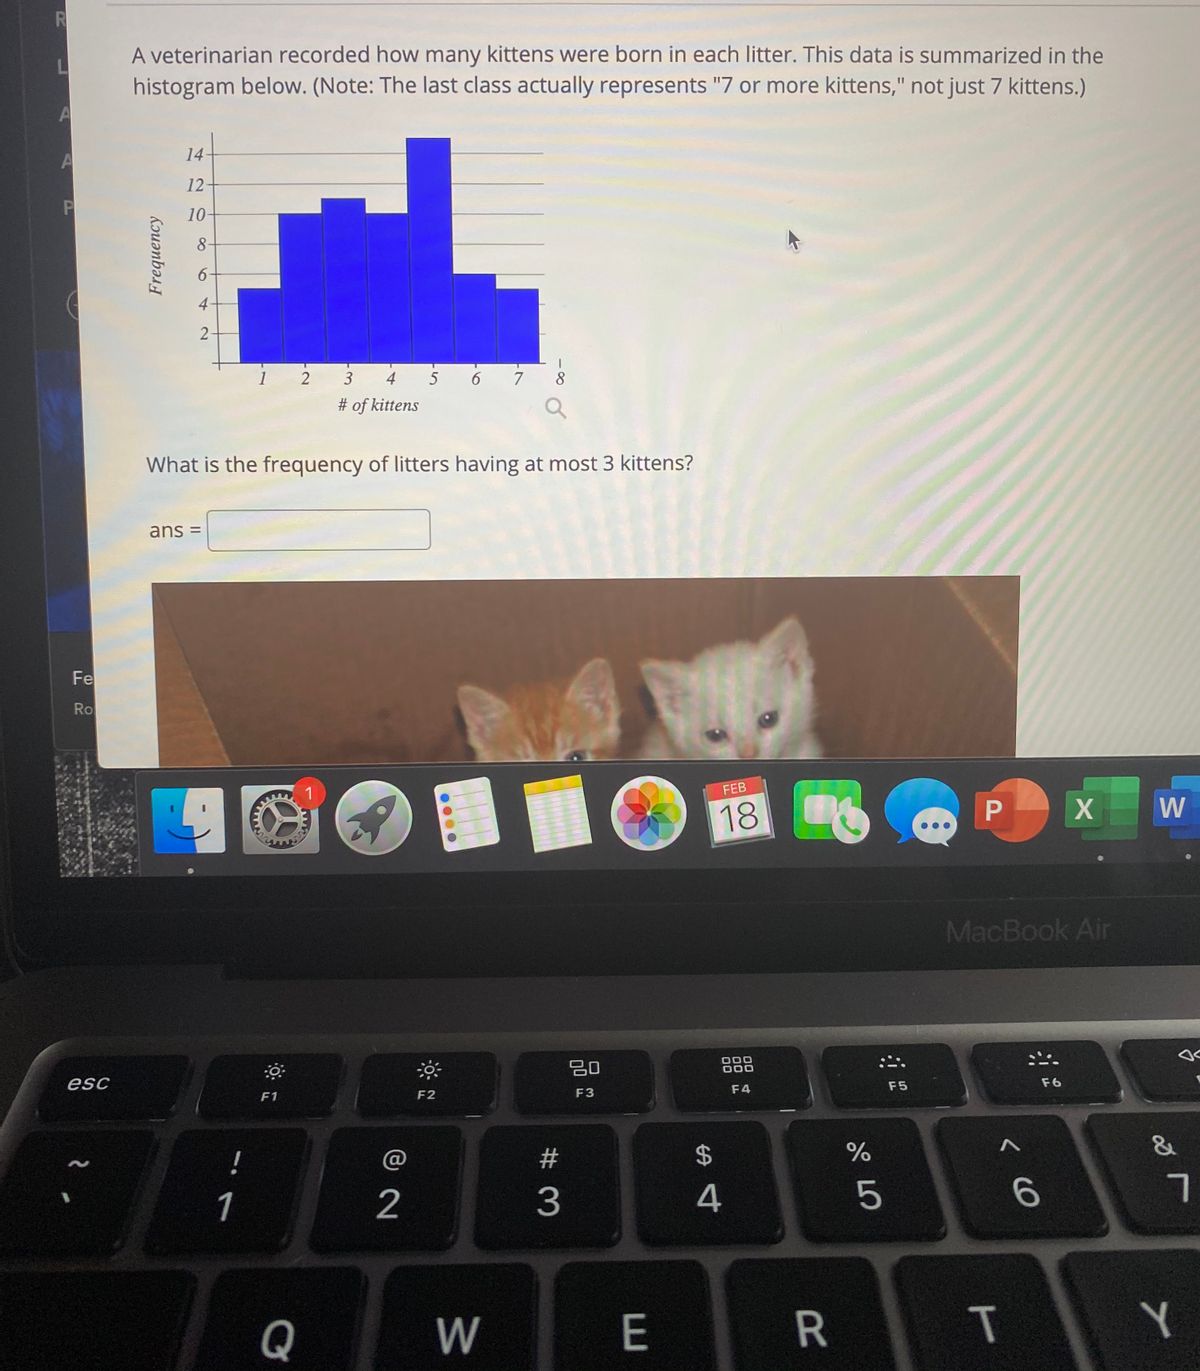
A veterinarian recorded how many kittens were born in each litter. This data is summarized in the
L
histogram below. (Note: The last class actually represents "7 or more kittens," not just 7 kittens.)
14
12
10-
8-
6-
4
1 2
3
4
7
8
# of kittens
What is the frequency of litters having at most 3 kittens?
ans =
Fe
Ro
1
FEB
18
P.
W
MacBook Air
20
000
esc
F5
F6
F2
F3
F4
F1
&
!
@
1
2
4
5
Q
W
R
%24
# 3
6
2.
Frequency
Expert Solution
arrow_forward
Step 1: Given information

Trending nowThis is a popular solution!

Step by stepSolved in 2 steps

Knowledge Booster


Learn more about
Need a deep-dive on the concept behind this application? Look no further. Learn more about this topic, statistics and related others by exploring similar questions and additional content below.Similar questions
- A pie chart reflects student performance... 16% As, 24% Bs, 32% Cs, 16% Ds, 12% Fs A. There were 317 students in total. How many students received As? B. If a student is selected at random what's the percentage it be a C student?arrow_forwardData Set: 3, 7, 11, 13, 16 What is the mean of this data set?arrow_forwardResearchers wondered whether the size of a person's brain was related to the individual's mental capacity. They selected a sample of 5 females and 5 males and measured their MRI image pixel counts and IQ scores. Females Males MRI IQ MRI IG The data is reported to the right. Complete parts (a) through (d) below 139 858,472 140 955,003 935,494 924,059 1.079.550 1,001.121 Click the icon to view the critical values table. 991,305 138 141 857,782 833,868 790,619 133 135 132 141 135 140 AMRI 1,080,000- AIO 145 AIO 145- AMRI 1,080,000 780,000 130 130 780,000 130 780,000 780,000 130 1,080,000 145 1,080,000 MRI 145 MRI (b) Compute the linear correlation coefficient between MRI count and IQ. Are MRI count and IQ linearly related? Select the correct choice below and, if necessary, fill in the answer box to complete your choice. (Round to three decimal places as needed.) A. Yes, MRI count and IQ are linearly related since the linear correlation coefficient is O B. No. MRI count and IQ are not…arrow_forward
- for the dataset c(1,2,2,2,4,5,6,6,7,8,9,9), what is the 75% or .75 quantile?arrow_forwardBiologists caught and measured 215 fish from the northern Atlantic Ocean. The lengths of the fish (in cm) are summarized in the histogram. 40 35 30 25 20 15 10 5 15 30 45 60 75 90 105 120 length of fish (cm) About what percentage of fish caught in this study had lengths between 45 cm and 75 cm? % Frequencyarrow_forwardK A university conducted a survey of 387 undergraduate students regarding satisfaction with student government. Results of the survey are shown in the table by class rank. Complete parts (a) through (d) below. Click the icon to view the table. 美 Data table Satisfied Neutral Not satisfied Total Freshman Sophomore Junior Senior 51 48 62 59 28 20 18 13 23 21 18 26 102 89 98 98 Total D₁ 220 79 88 387arrow_forward
- Twenty-five randomly selected students were asked the number of movies they watched the previous week. The results are as follows. # of movies Frequency Relative Frequency Cumulative Relative Frequency 0 5 1 9 2 6 3 4 4 1 Table 2.67 Construct a histogram of the data. Complete the columns of the chart.arrow_forwardThe two-way table given shows the results from a survey of pet owners. Owns a Dog Does Not Own a Dog Total Owns a Cat 54 21 75 Does Not Own a Cat 81 39 120 Total 135 60 195 Does the data show an association between owning a dog and owning a catarrow_forward7. Describe the shape of your data set by looking at the histogram. In your histogram how many classes are there? What is the class width?arrow_forward
- A scatter diagram can be used to visualize a pattern to the data. O True O Falsearrow_forwardA researcher is interested in determining if there is a relationship between handedness and penmanship. To study this question, the researcher submitted samples from 100 students to penmanship experts. The samples were rated to be of low, medium or high penmanship quality. The observed frequencies were totaled according to left verses right handedness. Penmanship Handedness low medium high Left 8 29 6 right 9 37 11 Which test is appropriate for this data? Why? Calculate row, column and table totals. State the null and alternative hypothesis. What is the degree of freedom? What is the value of the test statistic? What is the p-value? Are the data statistically significant at the 5% significance level? Do you recognize any flaws in this studyarrow_forwardDetermine the mean of the data.arrow_forward
arrow_back_ios
SEE MORE QUESTIONS
arrow_forward_ios
Recommended textbooks for you
- MATLAB: An Introduction with ApplicationsStatisticsISBN:9781119256830Author:Amos GilatPublisher:John Wiley & Sons Inc
 Probability and Statistics for Engineering and th...StatisticsISBN:9781305251809Author:Jay L. DevorePublisher:Cengage Learning
 Statistics for The Behavioral Sciences (MindTap C...StatisticsISBN:9781305504912Author:Frederick J Gravetter, Larry B. WallnauPublisher:Cengage Learning
  Elementary Statistics: Picturing the World (7th E...StatisticsISBN:9780134683416Author:Ron Larson, Betsy FarberPublisher:PEARSON
 The Basic Practice of StatisticsStatisticsISBN:9781319042578Author:David S. Moore, William I. Notz, Michael A. FlignerPublisher:W. H. Freeman
 Introduction to the Practice of StatisticsStatisticsISBN:9781319013387Author:David S. Moore, George P. McCabe, Bruce A. CraigPublisher:W. H. Freeman
MATLAB: An Introduction with Applications
Statistics
ISBN:9781119256830
Author:Amos Gilat
Publisher:John Wiley & Sons Inc
Probability and Statistics for Engineering and th...
Statistics
ISBN:9781305251809
Author:Jay L. Devore
Publisher:Cengage Learning
Statistics for The Behavioral Sciences (MindTap C...
Statistics
ISBN:9781305504912
Author:Frederick J Gravetter, Larry B. Wallnau
Publisher:Cengage Learning
Elementary Statistics: Picturing the World (7th E...
Statistics
ISBN:9780134683416
Author:Ron Larson, Betsy Farber
Publisher:PEARSON
The Basic Practice of Statistics
Statistics
ISBN:9781319042578
Author:David S. Moore, William I. Notz, Michael A. Fligner
Publisher:W. H. Freeman
Introduction to the Practice of Statistics
Statistics
ISBN:9781319013387
Author:David S. Moore, George P. McCabe, Bruce A. Craig
Publisher:W. H. Freeman