MATLAB: An Introduction with Applications
6th Edition
ISBN: 9781119256830
Author: Amos Gilat
Publisher: John Wiley & Sons Inc
expand_more
expand_more
format_list_bulleted
Question

Transcribed Image Text:Question 11
<
>
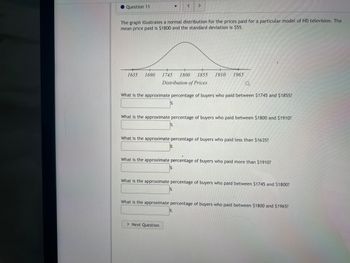
The graph illustrates a normal distribution for the prices paid for a particular model of HD television. The
mean price paid is $1800 and the standard deviation is $55.
1635 1690 1745 1800 1855 1910 1965
Distribution of Prices
a
What is the approximate percentage of buyers who paid between $1745 and $1855?
What is the approximate percentage of buyers who paid between $1800 and $1910?
What is the approximate percentage of buyers who paid less than $1635?
What is the approximate percentage of buyers who paid more than $1910?
What is the approximate percentage of buyers who paid between $1745 and $1800?
> Next Question
What is the approximate percentage of buyers who paid between $1800 and $1965?
Expert Solution
This question has been solved!
Explore an expertly crafted, step-by-step solution for a thorough understanding of key concepts.
This is a popular solution
Trending nowThis is a popular solution!
Step by stepSolved in 6 steps with 44 images

Knowledge Booster
Similar questions
- Using the table below creating a 3-year and 4-year moving average and predict sales for 2008. Find the mean absolute deviation (MAD) for both the 3 and 4 year moving averages.( MAD= Error Year 2001 2002 2003 2004 2005 2006 2007 2008 n Sales 2030 2155 2382 2412 2606 2892 3018 3-Year Moving Average MAD 3-Year Moving Average MAD 4-Year Moving Average Absolute Error 3-year Moving Average 4-Year Moving Average Absolute Error 4-Year Moving Averagearrow_forwardThe graph illustrates a normal distribution for the prices paid for a particular model of HD television. The mean price paid is $2000 and the standard deviation is $80 1760 1840 1920 2000 2080 2160 2240 Distribution of Prices What is the approximate percentage of buyers who paid between $2000 and S2160? 9% What is the approximate percentage of buyers who paid between $1920 and $2080? 0 0 What is the approximate percentage of buyers who paid between $2000 and S2080? 0 0 What is the approximate percentage of buyers who paid more than $2160 0 What is the approximate percentage of buyers who paid berween $2000 and $2240? 0 What is the approximate percentage of buyers m ho paid less than $1760?arrow_forwardItemized Charitable Contributions The average charitable contribution itemized per income tax return in Pennsylvania is $792. Suppose that the distribution of contributions is normal with a standard deviation of $105. Find the limits for the middle 42% of contributions. Use a graphing calculator and round the answers to two decimal places. The limits for the middle 42% of contributions are $ and $ %24arrow_forward
- The graph shows the distribution of the lengths (in seconds) of videos on a popular video-streaming site. The distribution is approximately Normal, with a mean What percentage of videos on the streaming site are between 264 and 489 seconds? 0.15% of 264 seconds and a standard deviation of 75 seconds. 49.85% 95% Streaming Videos 99.7% 36 30 114 189 264 339 414 489 564 Mark this and return Save and Exit Next Submit Previous Activity Next Activityarrow_forwardThe target population is the weekly income of students in 2017. The mean weekly income of STAT150 students in 2017 (population mean), µ, was $198 and the population standard deviation, o, was $34. A histogram of the weekly income of a large number of students from this population is shown, below, to illustrate the shape of the weekly income distribution. Frequency 70 60 50 40 30 20 10 0 140 160 Histogram of Weekly Income 180 220 Weekly Income 200 240 260 280 a) What shape is the distribution of student weekly income?arrow_forward
arrow_back_ios
arrow_forward_ios
Recommended textbooks for you
 MATLAB: An Introduction with ApplicationsStatisticsISBN:9781119256830Author:Amos GilatPublisher:John Wiley & Sons Inc
 Probability and Statistics for Engineering and th...StatisticsISBN:9781305251809Author:Jay L. DevorePublisher:Cengage Learning
 Statistics for The Behavioral Sciences (MindTap C...StatisticsISBN:9781305504912Author:Frederick J Gravetter, Larry B. WallnauPublisher:Cengage Learning
 Elementary Statistics: Picturing the World (7th E...StatisticsISBN:9780134683416Author:Ron Larson, Betsy FarberPublisher:PEARSON
 The Basic Practice of StatisticsStatisticsISBN:9781319042578Author:David S. Moore, William I. Notz, Michael A. FlignerPublisher:W. H. Freeman
 Introduction to the Practice of StatisticsStatisticsISBN:9781319013387Author:David S. Moore, George P. McCabe, Bruce A. CraigPublisher:W. H. Freeman

MATLAB: An Introduction with Applications
Statistics
ISBN:9781119256830
Author:Amos Gilat
Publisher:John Wiley & Sons Inc

Probability and Statistics for Engineering and th...
Statistics
ISBN:9781305251809
Author:Jay L. Devore
Publisher:Cengage Learning

Statistics for The Behavioral Sciences (MindTap C...
Statistics
ISBN:9781305504912
Author:Frederick J Gravetter, Larry B. Wallnau
Publisher:Cengage Learning

Elementary Statistics: Picturing the World (7th E...
Statistics
ISBN:9780134683416
Author:Ron Larson, Betsy Farber
Publisher:PEARSON

The Basic Practice of Statistics
Statistics
ISBN:9781319042578
Author:David S. Moore, William I. Notz, Michael A. Fligner
Publisher:W. H. Freeman

Introduction to the Practice of Statistics
Statistics
ISBN:9781319013387
Author:David S. Moore, George P. McCabe, Bruce A. Craig
Publisher:W. H. Freeman