
MATLAB: An Introduction with Applications
6th Edition
ISBN: 9781119256830
Author: Amos Gilat
Publisher: John Wiley & Sons Inc
expand_more
expand_more
format_list_bulleted
Related questions
Concept explainers
Question
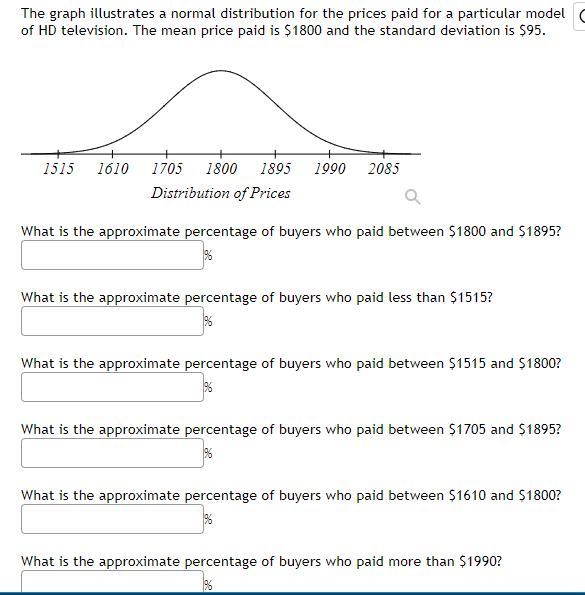

Transcribed Image Text:The graph illustrates a normal distribution for the prices paid for a particular model
of HD television. The mean price paid is $1800 and the standard deviation is $95.
1515
1610
1705
1800
1895
1990
2085
Distribution of Prices
What is the approximate percentage of buyers who paid between $1800 and $1895?
What is the approximate percentage of buyers who paid less than $1515?
What is the approximate percentage of buyers who paid between $1515 and $1800?
What is the approximate percentage of buyers who paid between $1705 and $1895?
What is the approximate percentage of buyers who paid between $1610 and $1800?
What is the approximate percentage of buyers who paid more than $1990?
Expert Solution
This question has been solved!
Explore an expertly crafted, step-by-step solution for a thorough understanding of key concepts.

This is a popular solution

Trending nowThis is a popular solution!

Step by stepSolved in 3 steps

Knowledge Booster


Learn more about
Need a deep-dive on the concept behind this application? Look no further. Learn more about this topic, statistics and related others by exploring similar questions and additional content below.Similar questions
- The graph illustrates a normal distribution for the prices paid for a particular model of HD television. The mean price paid is $2000 and the standard deviation is $90. 1730 1910 2000 2090 2180 2270 1820 Distribution of Prices What is the approximate percentage of buyers who paid less than $1820? What is the approximate percentage of buyers who paid between $1910 and $2090? What is the approximate percentage of buyers who paid less than $1730? What is the approximate percentage of buyers who paid between $2000 and $2270? What is the approximate percentage of buyers who paid between $1820 and $2000? What is the approximate percentage of buyers who paid between $1910 and $2000?arrow_forwardDetermine the whole number of standard deviations that includes all data values. The mean price of the nonfiction books on a best-sellers list is $21.18; the standard deviation is $2.08. $22.95, $22.95, $19.00, $20.95, $19.95, $25.00, $22.00, $22.00, $19.00, $18.00 All of the values fall within standard deviation(s) of the mean.arrow_forwardThe graph illustrates a normal distribution for the prices paid for a particular model of HD television. The mean price paid is $1200 and the standard deviation is $85.What is the approximate percentage of buyers who paid between $1115 and $1285?%What is the approximate percentage of buyers who paid between $1200 and $1370?%What is the approximate percentage of buyers who paid more than $1370?%What is the approximate percentage of buyers who paid between $1200 and $1455?%What is the approximate percentage of buyers who paid more than $1455?%What is the approximate percentage of buyers who paid between $1200 and $1285?%arrow_forward
- The incomes of math tutors in a tutoring center of a university are normally distributed with a mean of $1100 and a standard deviation of $150 what percentage of tutors earn less than $900 a montharrow_forwardThe graph illustrates a normal distribution for the prices paid for a particular model of HD television. The mean price paid is $1000 and the standard deviation is $85. What is the approximate percentage of buyers who paid more than $1170?%What is the approximate percentage of buyers who paid between $830 and $1000?%What is the approximate percentage of buyers who paid between $1000 and $1085?%What is the approximate percentage of buyers who paid between $915 and $1085?%What is the approximate percentage of buyers who paid less than $745?%What is the approximate percentage of buyers who paid between $1000 and $1255?arrow_forwardCost for standard veterinary services at a local animal hospital follows a Normal model with a mean of $80 and a standard deviation of $20. Fill in the blanks according to this model: The middle 95% of veterinary bills cost between $ type your answer.... 2 type your answer... type your answer... Previous 3 S 3 e d 4 % of veterinary bills are between $60 and $80. % of bills are between $20 and $140. r f % 5 t 9 A 6 y h & 7 and $ type your answer... U n ★ 8 i E 9 k ✔ O P ctriarrow_forward
- The graph illustrates a normal distribution for the prices paid for a particular model of HD television. The mean price paid is $1400 and the standard deviation is $75. 1175 1250 1325 1400 1475 1550 1625 Distribution of Prices What is the approximate percentage of buyers who paid between $1400 and $1625? What is the approximate percentage of buyers who paid between $1400 and $1550? What is the approximate percentage of buyers who paid more than $1550? What is the approximate percentage of buyers who paid less than $1175? What is the approximate percentage of buyers who paid between $1325 and $1475? What is the approximate percentage of buyers who paid between $1400 and $14752arrow_forwardThe graph illustrates a normal distribution for the prices paid for a particular model of HD television. The mean price paid is $1400 and the standard deviation is $50.What is the approximate percentage of buyers who paid between $1350 and $1450?%What is the approximate percentage of buyers who paid between $1350 and $1400?%What is the approximate percentage of buyers who paid between $1400 and $1500?%What is the approximate percentage of buyers who paid between $1250 and $1400?%What is the approximate percentage of buyers who paid more than $1500?%What is the approximate percentage of buyers who paid less than $1250?%arrow_forwardThe graph illustrates a normal distribution for the prices paid for a particular model of HD television. The mean price paid is $1600 and the standard deviation is $140.What is the approximate percentage of buyers who paid less than $1320? What is the approximate percentage of buyers who paid less than $1180?arrow_forward
arrow_back_ios
arrow_forward_ios
Recommended textbooks for you
- MATLAB: An Introduction with ApplicationsStatisticsISBN:9781119256830Author:Amos GilatPublisher:John Wiley & Sons Inc
 Probability and Statistics for Engineering and th...StatisticsISBN:9781305251809Author:Jay L. DevorePublisher:Cengage Learning
 Statistics for The Behavioral Sciences (MindTap C...StatisticsISBN:9781305504912Author:Frederick J Gravetter, Larry B. WallnauPublisher:Cengage Learning
  Elementary Statistics: Picturing the World (7th E...StatisticsISBN:9780134683416Author:Ron Larson, Betsy FarberPublisher:PEARSON
 The Basic Practice of StatisticsStatisticsISBN:9781319042578Author:David S. Moore, William I. Notz, Michael A. FlignerPublisher:W. H. Freeman
 Introduction to the Practice of StatisticsStatisticsISBN:9781319013387Author:David S. Moore, George P. McCabe, Bruce A. CraigPublisher:W. H. Freeman
MATLAB: An Introduction with Applications
Statistics
ISBN:9781119256830
Author:Amos Gilat
Publisher:John Wiley & Sons Inc
Probability and Statistics for Engineering and th...
Statistics
ISBN:9781305251809
Author:Jay L. Devore
Publisher:Cengage Learning
Statistics for The Behavioral Sciences (MindTap C...
Statistics
ISBN:9781305504912
Author:Frederick J Gravetter, Larry B. Wallnau
Publisher:Cengage Learning
Elementary Statistics: Picturing the World (7th E...
Statistics
ISBN:9780134683416
Author:Ron Larson, Betsy Farber
Publisher:PEARSON
The Basic Practice of Statistics
Statistics
ISBN:9781319042578
Author:David S. Moore, William I. Notz, Michael A. Fligner
Publisher:W. H. Freeman
Introduction to the Practice of Statistics
Statistics
ISBN:9781319013387
Author:David S. Moore, George P. McCabe, Bruce A. Craig
Publisher:W. H. Freeman