
MATLAB: An Introduction with Applications
6th Edition
ISBN: 9781119256830
Author: Amos Gilat
Publisher: John Wiley & Sons Inc
expand_more
expand_more
format_list_bulleted
Related questions
Question
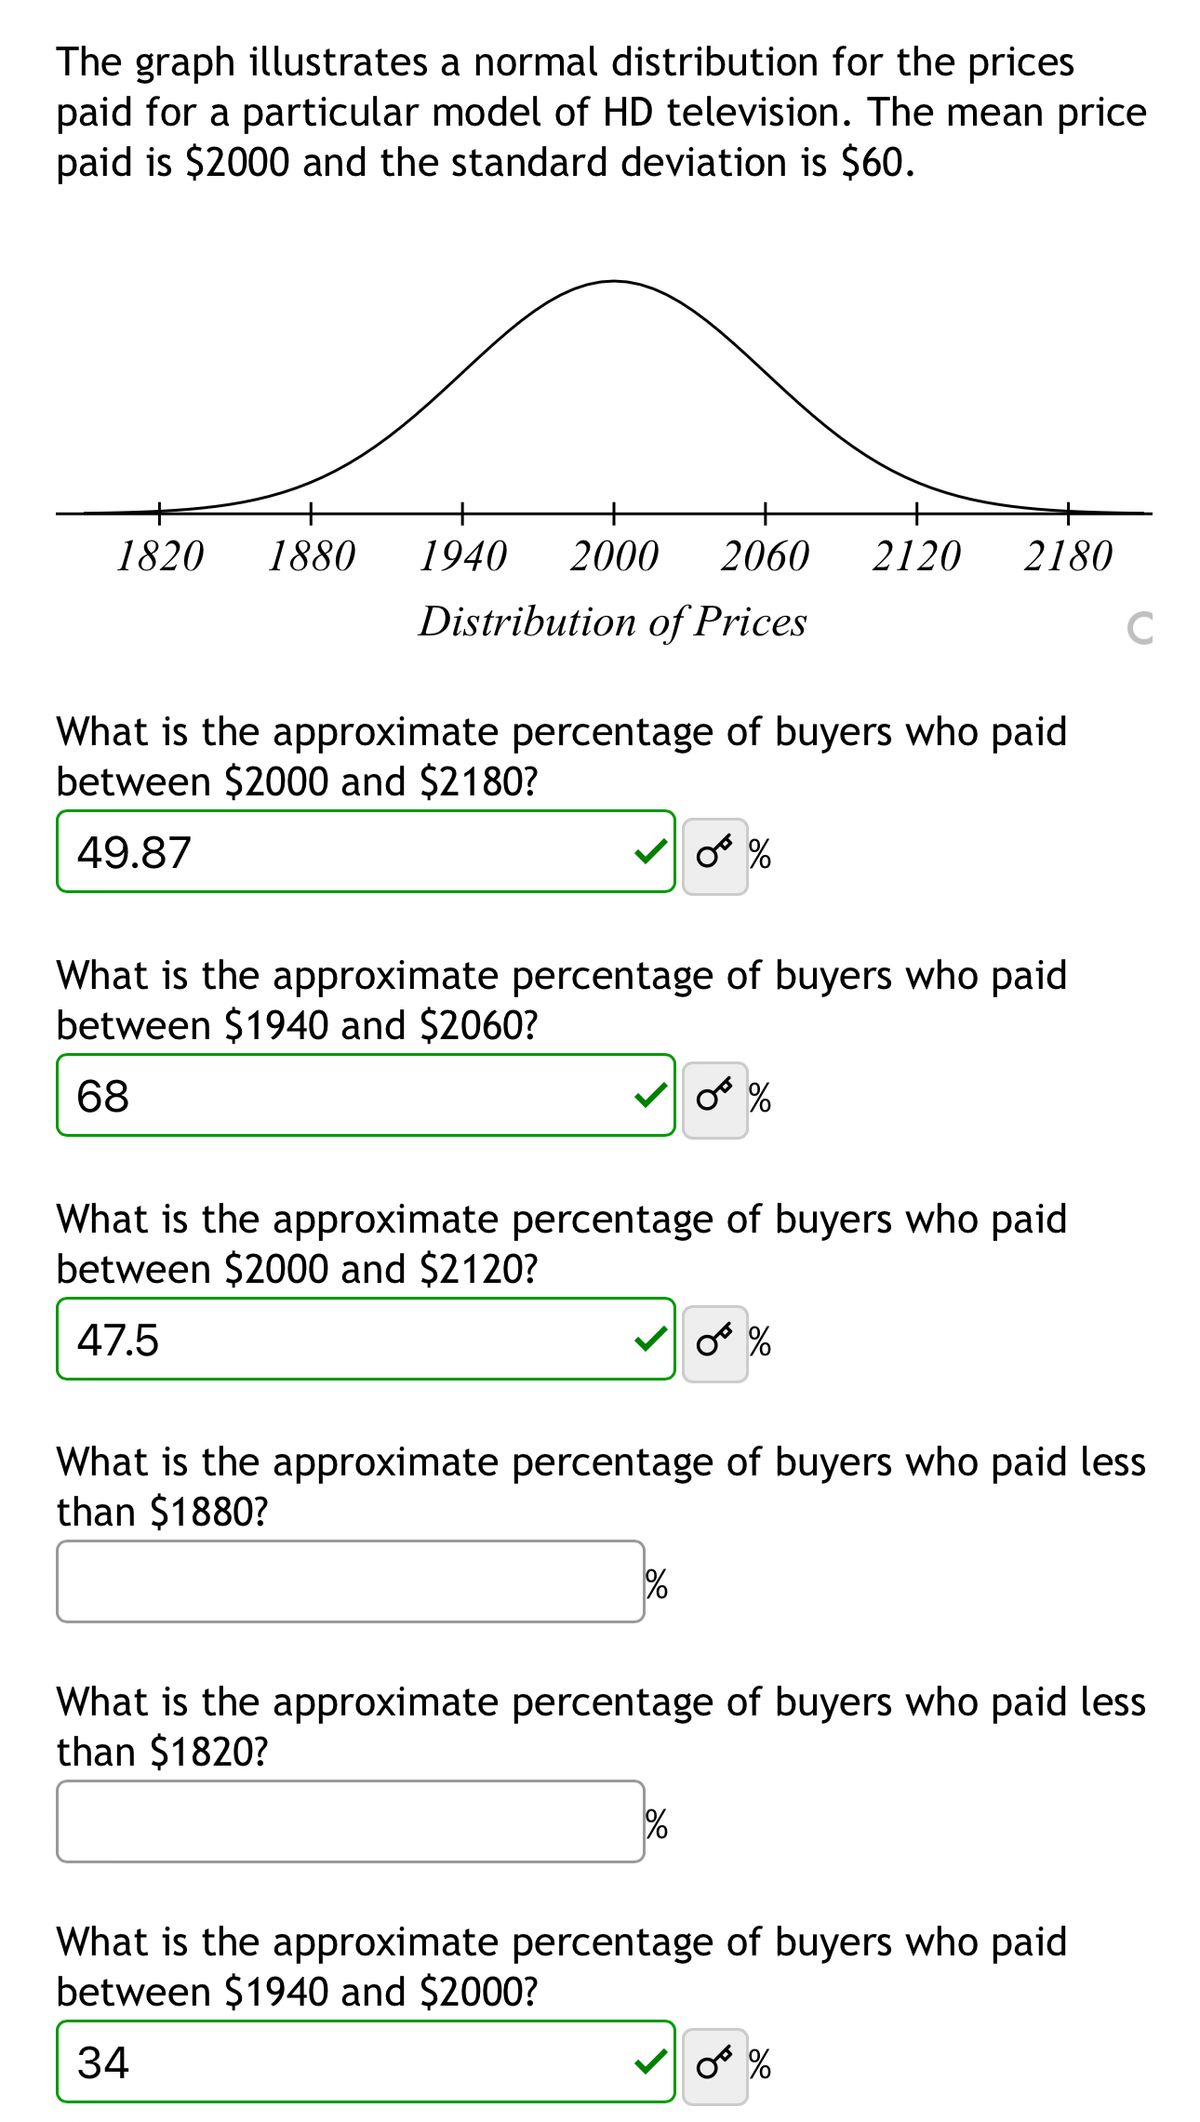

Transcribed Image Text:The graph illustrates a normal distribution for the prices
paid for a particular model of HD television. The mean price
paid is $2000 and the standard deviation is $60.
+
1820 1880 1940 2000
2060 2120
2180
Distribution of Prices
C
What is the approximate percentage of buyers who paid
between $2000 and $2180?
49.87
0%
What is the approximate percentage of buyers who paid
between $1940 and $2060?
68
0*%
What is the approximate percentage of buyers who paid
between $2000 and $2120?
47.5
☑0%
What is the approximate percentage of buyers who paid less
than $1880?
%
What is the approximate percentage of buyers who paid less
than $1820?
%
What is the approximate percentage of buyers who paid
between $1940 and $2000?
34
0%
SAVE
AI-Generated Solution
info
AI-generated content may present inaccurate or offensive content that does not represent bartleby’s views.
Unlock instant AI solutions
Tap the button
to generate a solution
to generate a solution
Click the button to generate
a solution
a solution
Knowledge Booster

Similar questions
- The following data represent the number of grams of fat in breakfast meals offered at a local fast food restaurant. (a) Construct a stem-and-leaf plot and (b) describe the shape of the distribution. Ite .. 12 19 32 10 17 D 31 15 7. 7. 26 29 43 19 20 19 4 14 28 26 34 (a) Construct the stem-and-leaf plot below. 0. 2 3 4. Legend. 5 1 represents 51 grams of fat. (b) The distribution is Enter your answer in each of the answer boxes.arrow_forwardThe table below lists the percent of a country's population that is foreign-born for selected years. Year 1930 1940 1950 6.7 1960 1970 5.3 1980 1990 2000 2008 Percent 11.4 8.5 4.6 6.5 8.1 10.2 12.3 Answer parts a through e. (a) Plot the data. Let x =0 correspond to the year 1930, x= 10 correspond to 1940, and so on. Choose the correct graph below. OA. B. Oc. OD. Q (0, 80,101 by (0,15,3] (b) Find a quadratic function f(x) = a(x-h) +k that models the data. Use (40,4.6) as the vertex and (20,6.7) as the other point to determine a. f(x) = (Use integers or decimals for any numbers in the expression. Type an integer or decimal rounded to four decimal places as needed.)arrow_forward31 43 56 23 42 42 33 61 44 28 48 38 44 35 40 64 52 42 47 39 53 27 36 35 20…arrow_forward
- A company has the following monthly sales for the past year. Plot the data points on a line graph and describe the results. Month Sales 1 145 2 146 3 145 4 150 5 148 6 150 7 156 8 160 9 158 10 153 11 152 12 154arrow_forwardA random sample of ten professional athletes produced the following data. The first row is the number of endorsements the athlete has and the second row is the amount of money made (in millions of dollars) by the athlete. What is the slope of the line of best fit? Round to 3 decimal places. Number of Endorsements 0 3 2 1 5 5 4 3 0 4 Profit (in Millions) 2 8 7 3 13 12 9 9 3 10arrow_forwardGiven this data set below which consists of 49 data values answer the questions that follow. 110 120 150 160 180 190 210 220 240 250 350 360 470 490 550 560 660 700 750 760 830 930 270 280 330 380 420 460 520 520 530 580 590 650 710 730 740 780 790 810 840 860 870 940 820 920 950 990 1000 (a) Find the 32nd percentile: P32 = (b) Find the 79th percentile: P79 = (c) Find the percentile for the data value 520. Enter a number as your answer. For example, if the percentile is the 15th, then enter 15. (d) Find the percentile for the data value 950. Enter a number as your answer. For example, if the percentile is the 15th, then enter 15.arrow_forward
- 2.5.27 The data show the number of hours spent studying per day by a sample of 28 students. Use the box-and-whisker plot below to answer parts (a) through (c) below. 1 11 6. 1 9 5 1 1 8 4 3. 4 6. 7. 0. 9. 7 Click the icon to view the box-and-whisker plot. (a) About 75% of the students studied no more than how many hours per day? About 75% of the students studied no more than hours per day. (Type an integer or decimal rounded to one decimal place as needed.) 3.arrow_forwardGive typed full explanationarrow_forwardThe monthly allowance in dollars for a random sample of high school students is displayed in the cumulative frequency graph below. Cumulative Percent 100 80 60 40 20 50 100 150 200 Monthly Allowance ($) Based on this graphical display, which of the following statements is justified? (A) A greater percentage of these students have monthly allowance between $50 and $75 than between $175 and $200. (B) The median monthly allowance for these students is about $100. (C) A greater percentage of these students have an allowance above $100 than below $100. (D) The minimum monthly allowance for these students is greater than $10. (E) The graph of the cumulative percent of monthly allowance for these students is skewed to the right.arrow_forward
- A professor went to a website for rating professors and looked up the quality rating and also the "easiness" of the six full-time professors in one department. The ratings are 1 (lowest quality) to 5 (highest quality) and 1 (hardest) to 5 (easiest). The numbers given are averages for each professor. Assume the trend is linear, find the correlation, and comment on what it means. Calculate the correlation. r = (Round to three decimal places as needed.) Comment on the meaning of the correlation. Choose the correct interpretation below. OA. The professors that have high easiness scores tend to also have low quality scores.. OB. Being "easy" as a professor causes students to regard the professor as having a higher quality. OC. The professors that have high easiness scores tend to also have high quality scores. OD. Being "easy" as a professor causes students to regard the professor as having a lower quality. Quality Easiness D 4.7 3.7 4.7 3.1 4.2 3.5 4.2 2.6 3.9 1.9 3.5 1.8arrow_forwardThe following graph shows the average grade point average for a particular college from 2004 until 2011. Average GPA 3.20 OA OC OD 3.15 3.10 3.05 3.00 2.95 2.90 2003 2004 2005 2006 2007 2008 2009 2010 2011 2012 Year Which one of the following statements is correct? A) Historically, the Average GPA of the college tends to decrease. B) There appears to be no relationship between Year and Average GPA. C) Year is the dependent variable in the graph. D) Average GPA is the dependent variable in the graph.arrow_forwardConstruct the cumulative frequency distribution for the given data. Age (years) of Best Actress when award was won 20-29 30-39 40-49 50-59 60-69 70-79 80-89 Frequency 25 34 11 3 7 2 2 Age (years) of Best Actress when award was won Cumulative Frequency Less than 30 Less than 40 Less than 50 Less than 60 Less than 70 Less than 80 Less than 90arrow_forward
arrow_back_ios
SEE MORE QUESTIONS
arrow_forward_ios
Recommended textbooks for you
- MATLAB: An Introduction with ApplicationsStatisticsISBN:9781119256830Author:Amos GilatPublisher:John Wiley & Sons Inc
 Probability and Statistics for Engineering and th...StatisticsISBN:9781305251809Author:Jay L. DevorePublisher:Cengage Learning
 Statistics for The Behavioral Sciences (MindTap C...StatisticsISBN:9781305504912Author:Frederick J Gravetter, Larry B. WallnauPublisher:Cengage Learning
  Elementary Statistics: Picturing the World (7th E...StatisticsISBN:9780134683416Author:Ron Larson, Betsy FarberPublisher:PEARSON
 The Basic Practice of StatisticsStatisticsISBN:9781319042578Author:David S. Moore, William I. Notz, Michael A. FlignerPublisher:W. H. Freeman
 Introduction to the Practice of StatisticsStatisticsISBN:9781319013387Author:David S. Moore, George P. McCabe, Bruce A. CraigPublisher:W. H. Freeman
MATLAB: An Introduction with Applications
Statistics
ISBN:9781119256830
Author:Amos Gilat
Publisher:John Wiley & Sons Inc
Probability and Statistics for Engineering and th...
Statistics
ISBN:9781305251809
Author:Jay L. Devore
Publisher:Cengage Learning
Statistics for The Behavioral Sciences (MindTap C...
Statistics
ISBN:9781305504912
Author:Frederick J Gravetter, Larry B. Wallnau
Publisher:Cengage Learning
Elementary Statistics: Picturing the World (7th E...
Statistics
ISBN:9780134683416
Author:Ron Larson, Betsy Farber
Publisher:PEARSON
The Basic Practice of Statistics
Statistics
ISBN:9781319042578
Author:David S. Moore, William I. Notz, Michael A. Fligner
Publisher:W. H. Freeman
Introduction to the Practice of Statistics
Statistics
ISBN:9781319013387
Author:David S. Moore, George P. McCabe, Bruce A. Craig
Publisher:W. H. Freeman