ENGR.ECONOMIC ANALYSIS
14th Edition
ISBN: 9780190931919
Author: NEWNAN
Publisher: Oxford University Press
expand_more
expand_more
format_list_bulleted
Question

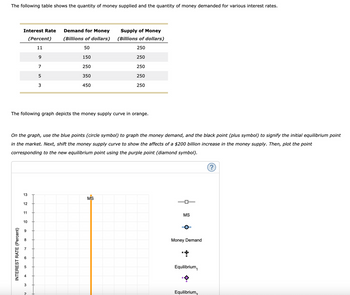
Transcribed Image Text:The following table shows the quantity of money supplied and the quantity of money demanded for various interest rates.
Interest Rate
(Percent)
Demand for Money
(Billions of dollars)
Supply of Money
(Billions of dollars)
11
50
250
9
150
250
7
250
250
5
350
250
3
450
250
The following graph depicts the money supply curve in orange.
On the graph, use the blue points (circle symbol) to graph the money demand, and the black point (plus symbol) to signify the initial equilibrium point
in the market. Next, shift the money supply curve to show the affects of a $200 billion increase in the money supply. Then, plot the point
corresponding to the new equilibrium point using the purple point (diamond symbol).
13
MS
12
11
10
INTEREST RATE (Percent)
+
5
M
9
3
2
MS
Money Demand
Equilibrium
Equilibrium,

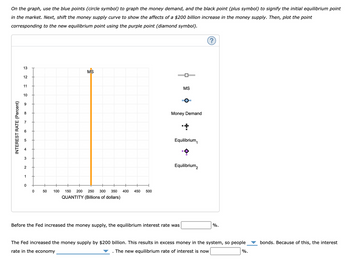
Transcribed Image Text:On the graph, use the blue points (circle symbol) to graph the money demand, and the black point (plus symbol) to signify the initial equilibrium point
in the market. Next, shift the money supply curve to show the affects of a $200 billion increase in the money supply. Then, plot the point
corresponding to the new equilibrium point using the purple point (diamond symbol).
13
MS
12
11
10
INTEREST RATE (Percent)
+
5
6
6
3
2
1
0
0
50
100 150 200 250 300 350 400
QUANTITY (Billions of dollars)
450 500
MS
Money Demand
Equilibrium
Equilibrium2
Before the Fed increased the money supply, the equilibrium interest rate was
%.
The Fed increased the money supply by $200 billion. This results in excess money in the system, so people
rate in the economy
The new equilibrium rate of interest is now
bonds. Because of this, the interest
%.
Expert Solution
This question has been solved!
Explore an expertly crafted, step-by-step solution for a thorough understanding of key concepts.
Step by stepSolved in 2 steps with 1 images

Knowledge Booster
Similar questions
- The following table gives the quantity of money demanded at various price levels (P), the money demand schedule. In the following table, fill in the column labeled Value of Money. Quantity of Money Demanded (Billions of dollars) Price Level (P) Value of Money (1/P) 0.80 1.25 1.00 1.00 1.33 0.75 2.00 0.50 2.0 2.5 4.0 8.0 Now consider the relationship between the quantity of money that people demand and the price level. The lower the price level, the less money required to complete transactions, and the less money people will want to hold in the form of currency or demand deposits. Assume that the Federal Reserve initially fixes the quantity of money supplied at $4 billion. Use the orange line (square symbol) to plot the initial money supply (MS₁) set by the Fed. Then, referring to the previous table, use the blue connected points (circle symbol) to graph the money demand curve. 2.00 1.75 1.50 0.75 0.50 0.25 ཱ་ཎྜ་ཉ་མ་༅་གླུ་སྒྲ་སྐྱ VALUE OF MONEY 1.25 Money Demand ° 1 2 3 4 5 B 7 QUANTITY…arrow_forward12arrow_forwardRefer to Figure 14.5. Assume the interest rate equals 8% and the money supply decreases from to . If the interest rate remains at 8%: money demand will increase. money demand will decrease. there will be an excess demand for money. there will be an excess supply of money.arrow_forward
- Suppose the money market for some hypothetical economy is given by the following graph, which plots the money demand and money supply curves. Assume the central bank in this economy (the Fed) fixes the quantity of money supplied. Suppose the price level decreases from 150 to 125. Shift the appropriate curve on the graph to show the impact of a decrease in the overall price level on the market for money. ? INTEREST RATE (Percent) 12 10 2 0 0 15 Money Supply Money Demand 30 45 60 MONEY (Billions of dollars) 75 90 Money Demand Money Supplyarrow_forwarduse a diagram to illustrate the demand and supply of moneyarrow_forwardWhat happens to the amount of money demanded or supplied in each of the following cases? Draw a separate money demand and money supply graph for each part of this question, label the axes, and show how the change will shift the money demand and/or the money supply curve. Explain any curve shifts in each case. Show initial and final equilibrium interest rate and quantity of money. a. The Central Bank sells securities in the open market while the economy is experiencing high inflation. b. The Central Bank decreases the required reserve ratio during a recession.arrow_forward
- In 1963, the average price for a gallon of gas was about $0.30. In 2014, the average price for a gallon of gas was about $3.37. What does this data show? In 1963, people carried more money in their pockets than they did in 2014. From 1963 to 2014, the money demand curve shifted leftward. The interest rates were most likely lower in 1963 than in 2014. The demand for money has increased significantly from 1963 to 2014.arrow_forwardQuestion 1 a. Increasing prices erode the purchasing power of the dollar. It is interesting to compute what goods would have cost at some point in the past after adjusting for inflation. Go to the Federal Reserve Bank of St. Louis, FRED database website at https://research.stlouisfed.org/fred2/and find the consumer price index for all urban consumers. What would a car that cost $25,000 today have cost the year 1996? b. Many countries have central banks that are responsible for their nation’s monetary policy. Go to www.bis.org/cbanks.htm and select one of the central banks (for example, ECB, Norway). Review that bank’s Web site to determine its policies regarding application of monetary policy. How does this bank’s policies compare to those of the U.S. central bank?arrow_forwardAssume that banks do not hold excess reserves and that households do not hold currency, so the only form of money is demand deposits. To simplify the analysis, suppose the banking system has total reserves of $100. Determine the money multiplier and the money supply for each reserve requirement listed in the following table. Reserve Requirement Simple Money Multiplier Money Supply (Percent) (Dollars) 25 10 A lower reserve requirement is associated with a money supply. Suppose the Federal Reserve wants to increase the money supply by $100. Again, you can assume that banks do not hold excess reserves and that households do not hold currency. If the reserve requirement is 10%, the Fed will use open-market operations to worth of U.S. government bonds. Now, suppose that, rather than immediately lending out all excess reserves, banks begin holding some excess reserves due to uncertain economic conditions.…arrow_forward
arrow_back_ios
SEE MORE QUESTIONS
arrow_forward_ios
Recommended textbooks for you

 Principles of Economics (12th Edition)EconomicsISBN:9780134078779Author:Karl E. Case, Ray C. Fair, Sharon E. OsterPublisher:PEARSON
 Engineering Economy (17th Edition)EconomicsISBN:9780134870069Author:William G. Sullivan, Elin M. Wicks, C. Patrick KoellingPublisher:PEARSON
 Principles of Economics (MindTap Course List)EconomicsISBN:9781305585126Author:N. Gregory MankiwPublisher:Cengage Learning
 Managerial Economics: A Problem Solving ApproachEconomicsISBN:9781337106665Author:Luke M. Froeb, Brian T. McCann, Michael R. Ward, Mike ShorPublisher:Cengage Learning
 Managerial Economics & Business Strategy (Mcgraw-...EconomicsISBN:9781259290619Author:Michael Baye, Jeff PrincePublisher:McGraw-Hill Education


Principles of Economics (12th Edition)
Economics
ISBN:9780134078779
Author:Karl E. Case, Ray C. Fair, Sharon E. Oster
Publisher:PEARSON

Engineering Economy (17th Edition)
Economics
ISBN:9780134870069
Author:William G. Sullivan, Elin M. Wicks, C. Patrick Koelling
Publisher:PEARSON

Principles of Economics (MindTap Course List)
Economics
ISBN:9781305585126
Author:N. Gregory Mankiw
Publisher:Cengage Learning

Managerial Economics: A Problem Solving Approach
Economics
ISBN:9781337106665
Author:Luke M. Froeb, Brian T. McCann, Michael R. Ward, Mike Shor
Publisher:Cengage Learning

Managerial Economics & Business Strategy (Mcgraw-...
Economics
ISBN:9781259290619
Author:Michael Baye, Jeff Prince
Publisher:McGraw-Hill Education