
MATLAB: An Introduction with Applications
6th Edition
ISBN: 9781119256830
Author: Amos Gilat
Publisher: John Wiley & Sons Inc
expand_more
expand_more
format_list_bulleted
Related questions
Concept explainers
Topic Video
Question
thumb_up100%
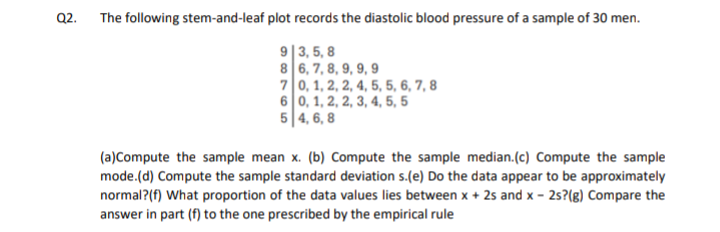

Transcribed Image Text:Q2. The following stem-and-leaf plot records the diastolic blood pressure of a sample of 30 men.
9|3, 5, 8
8 6, 7, 8, 9, 9, 9
70, 1, 2, 2, 4, 5, 5, 6, 7, 8
6 0, 1, 2, 2, 3, 4, 5, 5
5|4, 6, 8
(a)Compute the sample mean x. (b) Compute the sample median.(c) Compute the sample
mode.(d) Compute the sample standard deviation s.(e) Do the data appear to be approximately
normal?(f) What proportion of the data values lies between x + 2s and x - 25?(g) Compare the
answer in part (f) to the one prescribed by the empirical rule
Expert Solution
This question has been solved!
Explore an expertly crafted, step-by-step solution for a thorough understanding of key concepts.

This is a popular solution

Trending nowThis is a popular solution!

Step by stepSolved in 3 steps with 1 images

Knowledge Booster


Learn more about
Need a deep-dive on the concept behind this application? Look no further. Learn more about this topic, statistics and related others by exploring similar questions and additional content below.Similar questions
- The grades for 20 students on the most recent exam are given in the data table below. Round your answers to 2 decimal places as needed 46 71 41 94 50 47 85 86 98 72 82 40 47 80 44 89 61 66 81 96 Mean = Median = Standard deviation = Minimum score = Highest score =arrow_forwardfind population variance for given data 15,85,96,75,46,35,21,56,54,47arrow_forwardHere are the weights (in pounds) of 20 teens on an experimental food diet. 174, 142, 131, 145, 175, 150, 176, 151, 110, 162, 133, 163, 135, 178, 178, 154, 166, 146, 156, 167 What is the mean of the data?arrow_forward
- For the residents in 2014, use R to calculate the interval with 99% certainty that the interval contains the actual population mean of the residents by census tracts. Type in the interval with keyboard. We also know that in each year, the number of residents by census tract in the State of Maryland follows a normal distribution, and the variance in the number of residents within the State of Maryland is the same for different years. POP2014: 3072, 1989, 3794, 2689, 3211, 3722, 4385, 4009, 7598, 3862, 3097, 2726, 4881, 4157, 2570, 2512, 2518, 4863, 4147, 7139, 6067, 6819, 3705, 3239, 3824, 4977, 2576, 2940, 9791, 5231, 5634, 5337, 4205, 3888, 5562, 3335, 3770, 1808, 2045, 1532, 5420, 4993, 6109, 4377, 5424, 4976, 4507, 3738, 2827, 3485, 1559, 5199, 4702, 3971, 3803, 3356, 4670, 3816, 5477, 4760, 3126, 3630, 3755, 3795, 2578, 3382, 4005, 2442, 6096, 3799, 3843, 3836, 6046, 6431, 3561, 3142, 4829, 5058, 2471, 6119, 3523, 3094, 3146, 3356, 2618, 2366, 4266, 4016, 6080, 1554, 6878, 3645,…arrow_forwardFind the mean, the median and the mode of the given data set. (Round your answers to four decimal places. If there is more than one mode, enter your answers as a comma-separated list. If an answer does not exist, enter DNE.) S = {45, 45, 60, 70, 75, 75, 85} mean median modearrow_forwardAre there any mild outliers in the college students data? Show all work. Construct and label a modified boxplot for the college students data.arrow_forward
arrow_back_ios
arrow_forward_ios
Recommended textbooks for you
- MATLAB: An Introduction with ApplicationsStatisticsISBN:9781119256830Author:Amos GilatPublisher:John Wiley & Sons Inc
 Probability and Statistics for Engineering and th...StatisticsISBN:9781305251809Author:Jay L. DevorePublisher:Cengage Learning
 Statistics for The Behavioral Sciences (MindTap C...StatisticsISBN:9781305504912Author:Frederick J Gravetter, Larry B. WallnauPublisher:Cengage Learning
  Elementary Statistics: Picturing the World (7th E...StatisticsISBN:9780134683416Author:Ron Larson, Betsy FarberPublisher:PEARSON
 The Basic Practice of StatisticsStatisticsISBN:9781319042578Author:David S. Moore, William I. Notz, Michael A. FlignerPublisher:W. H. Freeman
 Introduction to the Practice of StatisticsStatisticsISBN:9781319013387Author:David S. Moore, George P. McCabe, Bruce A. CraigPublisher:W. H. Freeman
MATLAB: An Introduction with Applications
Statistics
ISBN:9781119256830
Author:Amos Gilat
Publisher:John Wiley & Sons Inc
Probability and Statistics for Engineering and th...
Statistics
ISBN:9781305251809
Author:Jay L. Devore
Publisher:Cengage Learning
Statistics for The Behavioral Sciences (MindTap C...
Statistics
ISBN:9781305504912
Author:Frederick J Gravetter, Larry B. Wallnau
Publisher:Cengage Learning
Elementary Statistics: Picturing the World (7th E...
Statistics
ISBN:9780134683416
Author:Ron Larson, Betsy Farber
Publisher:PEARSON
The Basic Practice of Statistics
Statistics
ISBN:9781319042578
Author:David S. Moore, William I. Notz, Michael A. Fligner
Publisher:W. H. Freeman
Introduction to the Practice of Statistics
Statistics
ISBN:9781319013387
Author:David S. Moore, George P. McCabe, Bruce A. Craig
Publisher:W. H. Freeman