
MATLAB: An Introduction with Applications
6th Edition
ISBN: 9781119256830
Author: Amos Gilat
Publisher: John Wiley & Sons Inc
expand_more
expand_more
format_list_bulleted
Related questions
Question
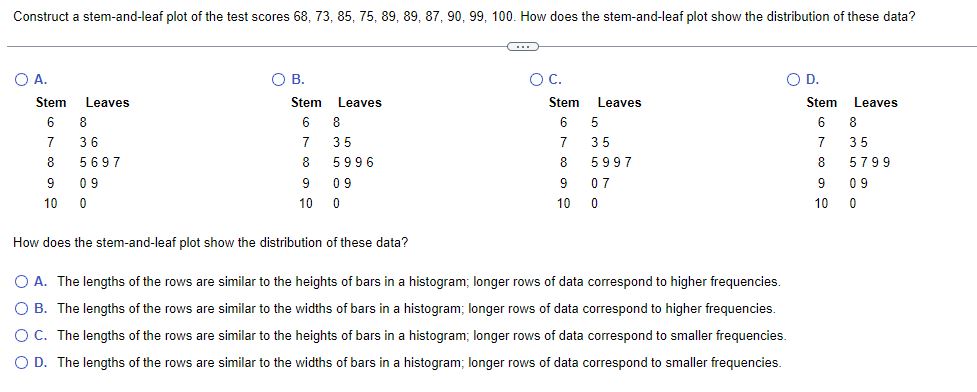

Transcribed Image Text:Construct a stem-and-leaf plot of the test scores 68, 73, 85, 75, 89, 89, 87, 90, 99, 100. How does the stem-and-leaf plot show the distribution of these data?
O A.
Stem Leaves
6 8
IF
7 36
8 5697
9 09
10 0
O B.
Stem Leaves
6 8
IF
7 35
8 5996
9 09
10 0
How does the stem-and-leaf plot show the distribution of these data?
O C.
Stem
6
7
8
9
10
Leaves
5
35
5997
07
0
O D.
O A. The lengths of the rows are similar to the heights of bars in a histogram; longer rows of data correspond to higher frequencies.
O B. The lengths of the rows are similar to the widths of bars in a histogram; longer rows of data correspond to higher frequencies.
OC. The lengths of the rows are similar to the heights of bars in a histogram; longer rows of data correspond to smaller frequencies.
O D. The lengths of the rows are similar to the widths of bars in a histogram; longer rows of data correspond to smaller frequencies.
Stem
6
7
8 5799
9
10 0
Leaves
8
35
09
Expert Solution
This question has been solved!
Explore an expertly crafted, step-by-step solution for a thorough understanding of key concepts.

This is a popular solution

Trending nowThis is a popular solution!

Step by stepSolved in 3 steps

Knowledge Booster

Similar questions
- Construct a stem-and-leaf plot of the test scores 68, 73, 86, 75, 89, 89, 88, 90, 98, 100. How does the stem-and-leaf plot show the distribution of these data? Construct the stem-and-leaf plot. Choose the correct answer below. A. В. C. D. Stem Leaves Stem Leaves Stem Leaves Stem Leaves 6 8. 6 8 7 36 7 35 7 35 7 35 8. 6 69 8 8. 6998 8 6996 8 6 899 0 9 9. 0 7 9. 0 8 9. 0 8 10 10 10 10 How does the stem-and-leaf plot show the distribution of these data? A. The lengths of the rows are similar to the heights of bars in a histogram; longer rows of data correspond to higher frequencies. B. The lengths of the rows are similar to the widths of bars in a histogram; longer rows of data correspond to smaller frequencies. C. The lengths of the rows are similar to the widths of bars in a histogram; longer rows of data correspond to higher frequencies. D. The lengths of the rows are similar to the heights of bars in a histogram; longer rows of data correspond to smaller frequencies.arrow_forwardA pediatrician wants to determine the relation that may exist between a child's height and head circumference. She randomly selects 8 children from her practice, measures their height and head circumference and obtains the data shown below. Height Head Circumference 27 17.5 25 17 26.5 17.2 25.5 17 27.75 17.4 26.25 17.4 26 17.1 27.25 17.4 data table 3 0.997 4 0.950 5 0.878 6 0.811 7 0.754 8 0.707 9 0.666 10 0.632 11 0.602 12 0.576 13 0.553 14 0.532 15 0.514 16 0.497 17 0.482 18 0.468 19 0.456 20 0.444 21 0.433 22 0.423 23 0.413 24 0.404 25 0.396 26 0.388 27 0.381 28 0.374…arrow_forwardFind mean, median, Q1 and Q3 for the following data. Determine whether there are outliers. Construct a box plot to represent this data. 2. 1 6 3. 2 4 5. 6 7 8 6. 0 0 2 2 2 8 9 7. 0 0 0 1 4 5 5 8 2 8. 1 2 2 6 8 8 9. 2 2 4 5 8 8arrow_forward
- 13arrow_forwardThe following are the exam scores for a new literature class: 34, 41, 90, 80, 18, 20, 25, 70, 25, 20, 50, 40, 36. The class follows a typical grading scare where 65% is the lowest passing gradeand 100% is the highest. Create a box plot. Be sure to identify all thenecessary terms. What can we infer from looking at the box plot?arrow_forwardHere is a data set: 24 18 21 32 21 29 29 35 20 39 31 18 20 18 28 22 26 22 34 34 You are examining the data with a split stem-and-leaf plot. Here is the start of the plot: 1 | 888 2 | 0011224 2 | 6899 31 3 | What should be entered in the second to last row of this table? 31 Question Help:Video Message instructorarrow_forward
- 8. Construct a box plot for the following data by finding the min, Q1, median, Q3, the max, and the IQR. 59, 50, 65, 68, 72, 80, 82arrow_forwardcalculate mean, median, standard deviation, range , IQR, and coefficient of variation for the following data 5,2,7,8,12,11,9,4,5,10arrow_forward1. The maximum number of sit-ups completed by the participants in an exercise class after 1 month of the program is given below. Construct a two-stem stem and leaf plot. 24 31 54 62 36 28 55 18 27 80 37 58 32 37 41 55 39 56 42 29 35 35 2. Find the mean, median, 20% trimmed mean, first quartile, and third quartile for the data in question 3. Show your work for credit. 3. A statistics class has 20 female students and 10 male students. Average exams score for the females is 78.5 and the average exam score for the males is 72.1. What is the average exam score of the entire class?arrow_forward
arrow_back_ios
SEE MORE QUESTIONS
arrow_forward_ios
Recommended textbooks for you
- MATLAB: An Introduction with ApplicationsStatisticsISBN:9781119256830Author:Amos GilatPublisher:John Wiley & Sons Inc
 Probability and Statistics for Engineering and th...StatisticsISBN:9781305251809Author:Jay L. DevorePublisher:Cengage Learning
 Statistics for The Behavioral Sciences (MindTap C...StatisticsISBN:9781305504912Author:Frederick J Gravetter, Larry B. WallnauPublisher:Cengage Learning
  Elementary Statistics: Picturing the World (7th E...StatisticsISBN:9780134683416Author:Ron Larson, Betsy FarberPublisher:PEARSON
 The Basic Practice of StatisticsStatisticsISBN:9781319042578Author:David S. Moore, William I. Notz, Michael A. FlignerPublisher:W. H. Freeman
 Introduction to the Practice of StatisticsStatisticsISBN:9781319013387Author:David S. Moore, George P. McCabe, Bruce A. CraigPublisher:W. H. Freeman
MATLAB: An Introduction with Applications
Statistics
ISBN:9781119256830
Author:Amos Gilat
Publisher:John Wiley & Sons Inc
Probability and Statistics for Engineering and th...
Statistics
ISBN:9781305251809
Author:Jay L. Devore
Publisher:Cengage Learning
Statistics for The Behavioral Sciences (MindTap C...
Statistics
ISBN:9781305504912
Author:Frederick J Gravetter, Larry B. Wallnau
Publisher:Cengage Learning
Elementary Statistics: Picturing the World (7th E...
Statistics
ISBN:9780134683416
Author:Ron Larson, Betsy Farber
Publisher:PEARSON
The Basic Practice of Statistics
Statistics
ISBN:9781319042578
Author:David S. Moore, William I. Notz, Michael A. Fligner
Publisher:W. H. Freeman
Introduction to the Practice of Statistics
Statistics
ISBN:9781319013387
Author:David S. Moore, George P. McCabe, Bruce A. Craig
Publisher:W. H. Freeman