The following observations are on stopping distance (ft) of a particular truck at 20 mph under specified experimental conditions. 32.1 30.8 31.5 30.4 31.0 31.9 LAUSE SALT The report states that under these conditions, the maximum allowable stopping distance is 30. A normal probability plot validates the assumption that stopping distance is normally distr (a) Does the data suggest that true average stopping distance exceeds this maximum value? Test the appropriate hypotheses using a = 0.01. State the appropriate hypotheses. Hoi A = 30 H: <30 Hoi A = 30 H₂:30 Ho: 30 H₂: H=30 O Ho: H=30 H₂:μ> 30 places)
The following observations are on stopping distance (ft) of a particular truck at 20 mph under specified experimental conditions. 32.1 30.8 31.5 30.4 31.0 31.9 LAUSE SALT The report states that under these conditions, the maximum allowable stopping distance is 30. A normal probability plot validates the assumption that stopping distance is normally distr (a) Does the data suggest that true average stopping distance exceeds this maximum value? Test the appropriate hypotheses using a = 0.01. State the appropriate hypotheses. Hoi A = 30 H: <30 Hoi A = 30 H₂:30 Ho: 30 H₂: H=30 O Ho: H=30 H₂:μ> 30 places)

A First Course in Probability (10th Edition)
10th Edition
ISBN:9780134753119
Author:Sheldon Ross
Publisher:Sheldon Ross
Chapter1: Combinatorial Analysis
Section: Chapter Questions
Problem 1.1P: a. How many different 7-place license plates are possible if the first 2 places are for letters and...

Related questions
Question
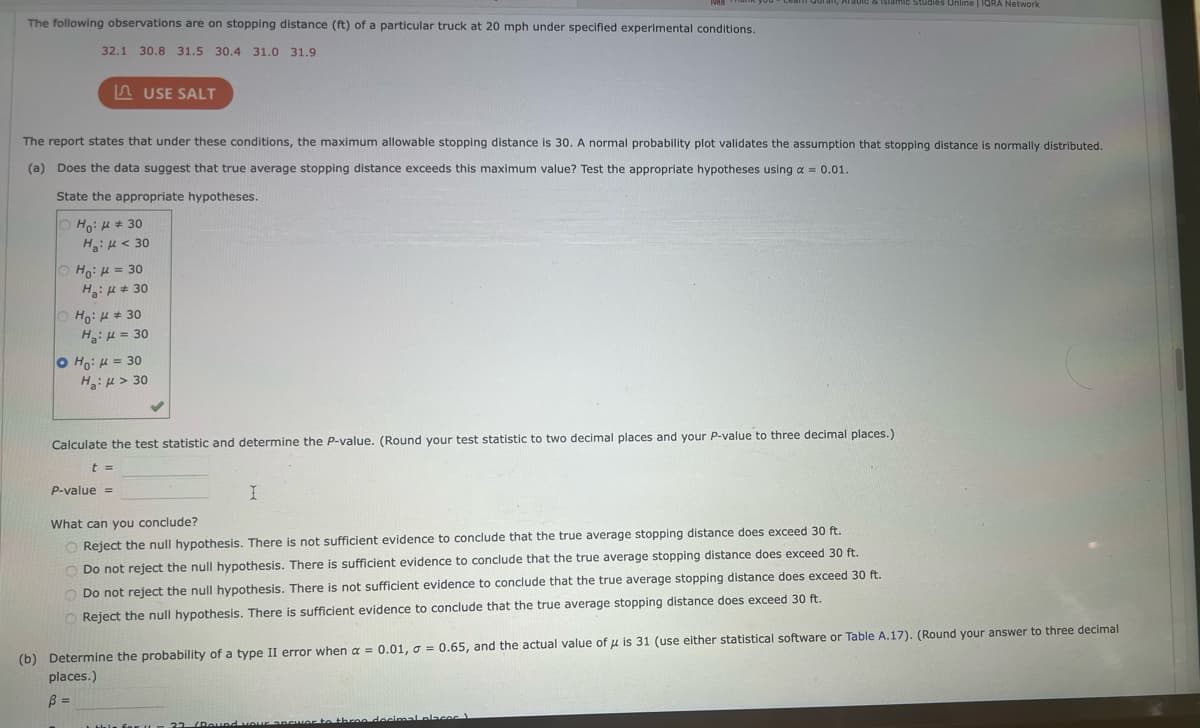
Transcribed Image Text:The following observations are on stopping distance (ft) of a particular truck at 20 mph under specified experimental conditions.
32.1 30.8 31.5 30.4 31.0 31.9
USE SALT
Ho: 30
Hζί με 30
The report states that under these conditions, the maximum allowable stopping distance is 30. A normal probability plot validates the assumption that stopping distance is normally distributed.
(a) Does the data suggest that true average stopping distance exceeds this maximum value? Test the appropriate hypotheses using a = 0.01.
State the appropriate hypotheses.
Ho: μ = 30
Ha:
30
Ho:
30
Ha: μ = 30
Ho: μ = 30
H₂: > 30
IVAN
Calculate the test statistic and determine the P-value. (Round your test statistic to two decimal places and your P-value to three decimal places.)
t =
P-value =
1 this for
I
Quran, Arabic & Islamic Studies Online | IQRA Network
What can you conclude?
O Reject the null hypothesis. There is not sufficient evidence to conclude that the true average stopping distance does exceed 30 ft.
O Do not reject the null hypothesis. There is sufficient evidence to conclude that the true average stopping distance does exceed 30 ft.
Do not reject the null hypothesis. There is not sufficient evidence to conclude that the true average stopping distance does exceed 30 ft.
Reject the null hypothesis. There is sufficient evidence to conclude that the true average stopping distance does exceed 30 ft.
22
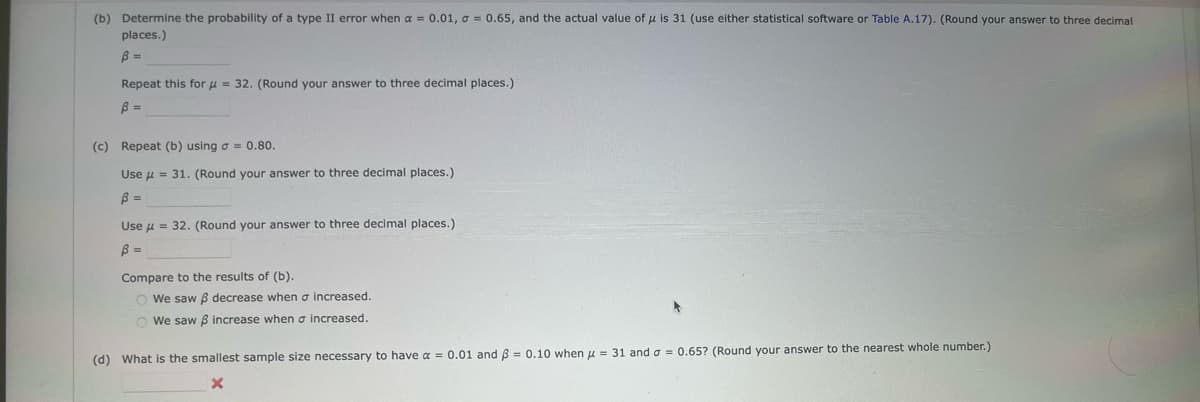
(b) Determine the probability of a type II error when a = 0.01, o = 0.65, and the actual value of μ is 31 (use either statistical software or Table A.17). (Round your answer to three decimal
places.)
ß =
(Round your power to three decimal places
Transcribed Image Text:(b) Determine the probability of a type II error when a = 0.01, o = 0.65, and the actual value of μ is 31 (use either statistical software or Table A.17). (Round your answer to three decimal
places.)
B =
Repeat this for μ = 32. (Round your answer to three decimal places.)
B =
(c) Repeat (b) using a = 0.80.
Use μ = 31. (Round your answer to three decimal places.)
B =
Use μ = 32. (Round your answer to three decimal places.)
B =
Compare to the results of (b).
We saw ß decrease when a increased.
We saw ß increase when a increased.
(d) What is the smallest sample size necessary to have a = 0.01 and 3 = 0.10 when u = 31 and = 0.65? (Round your answer to the nearest whole number.)
X
Expert Solution
This question has been solved!
Explore an expertly crafted, step-by-step solution for a thorough understanding of key concepts.

Step by step
Solved in 4 steps with 46 images

Recommended textbooks for you
A First Course in Probability (10th Edition)
Probability
ISBN:
9780134753119
Author:
Sheldon Ross
Publisher:
PEARSON

A First Course in Probability (10th Edition)
Probability
ISBN:
9780134753119
Author:
Sheldon Ross
Publisher:
PEARSON