
MATLAB: An Introduction with Applications
6th Edition
ISBN: 9781119256830
Author: Amos Gilat
Publisher: John Wiley & Sons Inc
expand_more
expand_more
format_list_bulleted
Related questions
Concept explainers
Topic Video
Question
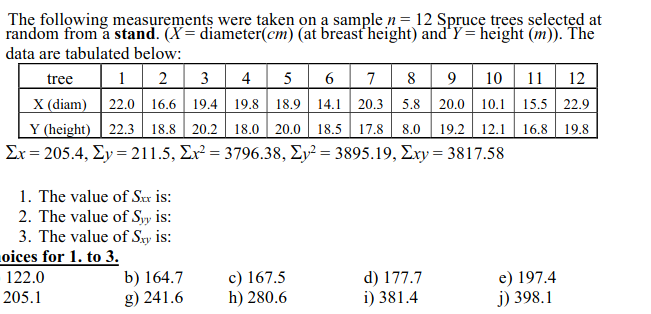

Transcribed Image Text:The following measurements were taken on a sample n= 12 Sprucę trees selected at
random from å stand. (X= diameter(cm) (at breasť height) and'Y = height (m)). The
data are tabulated below:
6 7 8 9 10 | 11 | 12
tree 1 2 3 | 4 | 5_
X (diam) 22.0 16.6 19.4 19.8 18.9 14.1 20.3 5.8 20.0 10.1 15.5 22.9
Y (height) 22.3 | 18.8 20.2 18.0 20.0 18.5 17.8 8.0 19.2 12.1 16.8 19.8
Σx-205.4, Σy- 211.5, Σ3796.38 , Σν-3895.19, Σsy - 3817.58
1. The value of Sx is:
2. The value of Syy is:
3. The value of Sxy is:
oices for 1. to 3.
b) 164.7
g) 241.6
c) 167.5
h) 280.6
122.0
d) 177.7
i) 381.4
e) 197.4
205.1
j) 398.1
Expert Solution
This question has been solved!
Explore an expertly crafted, step-by-step solution for a thorough understanding of key concepts.

This is a popular solution

Trending nowThis is a popular solution!

Step by stepSolved in 2 steps

Knowledge Booster


Learn more about
Need a deep-dive on the concept behind this application? Look no further. Learn more about this topic, statistics and related others by exploring similar questions and additional content below.Similar questions
- (3-B is needed to answer it I am only asking for question 4.) 3) You go out and collect the following estimates of earthworms / acre:54,276 57,378 51,108 66,190 66,232 59,018 57,159These data yield the following: ̄y = 59,765.86, and s = 5,689.606a) Construct a 90% CI for these data.b) Construct a 99% CI for these data.c) Darwin once estimated that an acre of soil had about 50,000 worms in it. Is his estimateconsistent with the data above? (Historical note: His estimate was considered way too high inhis day). 4) Consider the results of 3(b). Notice that all the data fit within the 99% confidence interval. Is thisusually the case (in other words, will a 99% CI contain most of the observations)?Caution: a lot of people get this wrong! Here's a hint: suppose you had measured the worms in6000 acres (instead of just 7). What happens to the confidence interval? If you're not sure,substitute 6,000 for 7 in your calculation for (b) to see what happens.arrow_forwardLet the height data (105)represent sample. Use an appropriate statistical test to check whether the population mean is different from 170 cm.Use α = 0.05.Also, write a substantive conclusion and explanation. Use an appropriate graph to check if data is normally distributed. Do it in R commander.arrow_forward3..arrow_forward
- The following data (excluded outlier) is collected from a student's (David) exam score. Assume that distribution is normally distributed. David's exam score: 71 a) Analyze David's exam score based on the above table. b) Assume that distribution is bell-shaped, find the percentage who scored greater than David. Analyze his exam score based on the percentage you found.arrow_forwardIf you recieved the data set {9, 16, 10, 20, X} and you knew the median was 15, what could you say about X? O 10 < X < 18 OX = 14 O11 < X < 17 OX = 15 ONone of the above.arrow_forwardSaid that trey watched the hornd (0 EO a SurNEN SE G00 adults 240 Cup final cn T.V. USing trese e Statistics, of error, E, Con fidlence loterval for the popation Caiculate Sample the margin for a 90% Of Gll Stu deots that watched the Warld cup final co t.v.arrow_forward
arrow_back_ios
arrow_forward_ios
Recommended textbooks for you
- MATLAB: An Introduction with ApplicationsStatisticsISBN:9781119256830Author:Amos GilatPublisher:John Wiley & Sons Inc
 Probability and Statistics for Engineering and th...StatisticsISBN:9781305251809Author:Jay L. DevorePublisher:Cengage Learning
 Statistics for The Behavioral Sciences (MindTap C...StatisticsISBN:9781305504912Author:Frederick J Gravetter, Larry B. WallnauPublisher:Cengage Learning
  Elementary Statistics: Picturing the World (7th E...StatisticsISBN:9780134683416Author:Ron Larson, Betsy FarberPublisher:PEARSON
 The Basic Practice of StatisticsStatisticsISBN:9781319042578Author:David S. Moore, William I. Notz, Michael A. FlignerPublisher:W. H. Freeman
 Introduction to the Practice of StatisticsStatisticsISBN:9781319013387Author:David S. Moore, George P. McCabe, Bruce A. CraigPublisher:W. H. Freeman
MATLAB: An Introduction with Applications
Statistics
ISBN:9781119256830
Author:Amos Gilat
Publisher:John Wiley & Sons Inc
Probability and Statistics for Engineering and th...
Statistics
ISBN:9781305251809
Author:Jay L. Devore
Publisher:Cengage Learning
Statistics for The Behavioral Sciences (MindTap C...
Statistics
ISBN:9781305504912
Author:Frederick J Gravetter, Larry B. Wallnau
Publisher:Cengage Learning
Elementary Statistics: Picturing the World (7th E...
Statistics
ISBN:9780134683416
Author:Ron Larson, Betsy Farber
Publisher:PEARSON
The Basic Practice of Statistics
Statistics
ISBN:9781319042578
Author:David S. Moore, William I. Notz, Michael A. Fligner
Publisher:W. H. Freeman
Introduction to the Practice of Statistics
Statistics
ISBN:9781319013387
Author:David S. Moore, George P. McCabe, Bruce A. Craig
Publisher:W. H. Freeman