A First Course in Probability (10th Edition)
10th Edition
ISBN: 9780134753119
Author: Sheldon Ross
Publisher: PEARSON
expand_more
expand_more
format_list_bulleted
Question

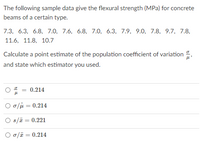
Transcribed Image Text:The following sample data give the flexural strength (MPa) for concrete
beams of a certain type.
7.3, 6.3, 6.8, 7.0, 7.6, 6.8, 7.0, 6.3, 7.9, 9.0, 7.8, 9.7, 7.8,
11.6, 11.8, 10.7
Calculate a point estimate of the population coefficient of variation
and state which estimator you used.
0.214
O o/ji = 0.214
O s/ē = 0.221
O o/ī = 0.214
Expert Solution
This question has been solved!
Explore an expertly crafted, step-by-step solution for a thorough understanding of key concepts.
This is a popular solution
Trending nowThis is a popular solution!
Step by stepSolved in 2 steps with 2 images

Knowledge Booster
Similar questions
- Which of the following statistics are unbiased estimators of the population parameter? Select all that apply. A) Sample mean B) Sample proportion C) Sample rangearrow_forwardThe table below shows the distribution of weight of a certain type of fruit. weight frequency <10 4 <15 3 <20 23 <25 54 <30 16 <35 9 <40 7 <45 4 1) Draw the histogram of the data and use it to estimate the model weight. 2) calculate mean, median and interquartile range.arrow_forwardThe sample mean is often used as an estimator of the population mean because of its desirable properties, including: a. unbiasedness, consistency and efficiency Ob.consistency and minimum sampling error only Oc unbiasedness and consistency only Od. unbiasedness and efficiency only Oe. unbiasedness, consistency and minimum sampling errorarrow_forward
- The following sample data give the flexural strength (MPa) for concrete beams of a certain type. 7.3, 6.3, 6.8, 7.0, 7.6, 6.8, 7.0, 6.3, 7.9, 9.0, 7.8, 9.7, 7.8, 11.6, 11.8, 10.7 Calculate a point estimate of the mean value of strength for the conceptual population of all beams manufactured in this fashion, and give the estimator you used. O Etr(6.25) = 8.09 μ. 8.21 * = 8.21 * = 8.14arrow_forwardConsider a sample with data values of 57,45,50,39,50,59,60, and 48. Compute the following values a. Mode b. 40th percentile c. Variance d. Standard deviation e. Coefficient of variationarrow_forwardA boat capsized and sank in a lake. Based on an assumption of a mean weight of 142 lb, the boat was rated to carry 60 passengers (so the load limit was 8,520 lb). After the boat sank, the assumed mean weight for similar boats was changed from 142 lb to 171 lb. Complete parts a and b below. a. Assume that a similar boat is loaded with 60 passengers, and assume that the weights of people are normally distributed with a mean of 178.5 lb and a standard deviation of 36.9 lb. Find the probability that the boat is overloaded because the 60 passengers have a mean weight greater than 142 lb. The probability is 1.000. (Round to four decimal places as needed.) C.. b. The boat was later rated to carry only 13 passengers, and the load limit was changed to 2,223 lb. Find the probability that the boat is overloaded because the mean weight of the passengers is greater than 171 (so that their total weight is greater than the maximum capacity of 2,223 lb). The probability is. (Round to four decimal…arrow_forward
- Listed below are times (in minutes and seconds) that a statistics instructor recorded while riding a bicycle for five laps through each mile of a 3-mile loop. Use a 0.10 significance lev the claim that the samples are from populations with the same median. What do the data suggest? Mile 1 Mile 2 Mile 3 3:18 3:25 3:31 3:14 3:30 3:31 3:15 3:25 3:35 3:20 3:26 3:28 3:16 3:24 3:27 First determine the null and alternative hypotheses. Choose the correct answer below. A. Ho: The samples come from populations with equal medians. H₁: The samples come from populations with medians that are not all equal. D O B. Ho: The samples come from populations with means that are not all equal. H₁: The samples come from populations with equal means. O D. Ho: The samples come from populations with equal means. Compute the test statistic. The test statistic is. (Round to three decimal places as needed.) OC. Ho: The samples come from populations with medians that are not all equal. H₁: The samples come from…arrow_forwardThe article cited in Exercise 19 provides measures of electrical conductivity (in uS/cm). The results are presented in the following table. Sample Size 49 Location Mean SD Upstream 463 208 Midstream 363 98 31 Downstream 647 878 30 Can a one-way analysis of variance be used to determine whether conductivity varies with location? Or is one of the necessary assumptions violated? Explain.arrow_forward
arrow_back_ios
arrow_forward_ios
Recommended textbooks for you
 A First Course in Probability (10th Edition)ProbabilityISBN:9780134753119Author:Sheldon RossPublisher:PEARSON

A First Course in Probability (10th Edition)
Probability
ISBN:9780134753119
Author:Sheldon Ross
Publisher:PEARSON
