MATLAB: An Introduction with Applications
6th Edition
ISBN: 9781119256830
Author: Amos Gilat
Publisher: John Wiley & Sons Inc
expand_more
expand_more
format_list_bulleted
Question
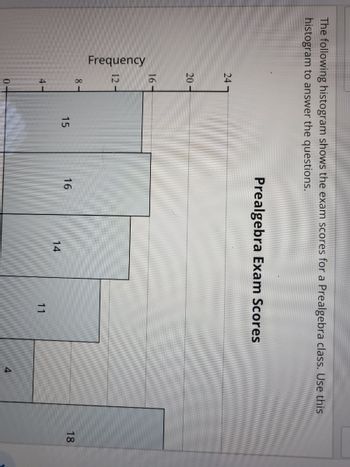
The following histogram shows the exam scores for a pre algebra class. Uses histogram to answer the questions.. Find the number of class containing the largest number of exam scores 12345 or 6

Transcribed Image Text:The following histogram shows the exam scores for a Prealgebra class. Use this
histogram to answer the questions.
Frequency
24
20
16
12-
8
4
15
Prealgebra Exam Scores
16
14
11
4
18
Expert Solution
This question has been solved!
Explore an expertly crafted, step-by-step solution for a thorough understanding of key concepts.
Step by stepSolved in 3 steps

Knowledge Booster
Similar questions
- How do I create a histogram in excel?arrow_forwardA recent Nielsen analysis found that the typical U.S. smartphone user is spending an average of 220 minutes per day using apps. We speculate that the average time spent using apps for Generation X smartphone users (aged 41-56 years) is less than the national average. The hypotheses are Ho: H = 220 minutes versus Ha: µ < 220 minutes. Summary results from R are provided. Summary Statistics Std. Dev (s) Mean Sample Size (n) 205 minutes 63.25 minutes 31arrow_forwardYou want to find out the top three food items sold in your school cafeteria. Select the best way to generate a list of this data. Survey the students in your math class. Gather data about the number of sales of each food item from the cashier. Interview all the teachers about what they consider to be the top food item. Ask 10% of the students in each grade to tell you their choice for the top food item.arrow_forward
- For the special Thanksgiving edition of the local newspaper, a reporter wrote a heartwarming piece. In the piece there appeared figures on the number of turkey dinners served by various local charities. The histogram below summarizes the data. Use the histogram to answer each of the questions. Frequency (Number of charities) 10- 9. 8 7 5. 3 2 1 90 to 139 140 to 189 190 to 239 240 to 289 Number of turkey dinners (a) What is the class width? (b) According to the histogram, what is the total number of charities? (c) How many charities served from 190 to 239 turkey dinners? Oarrow_forwardFind the SLG Percentage for Mr Hodowith 52 doubles, 31 singles, 2 triples, 61homeruns, and 335 at bats.arrow_forwardAfter giving a statistics exam, professor Dang determined the following five-number summary for her class results: 60 68 77 89 98. Use this information to draw a box plot of the exam scoresarrow_forward
- Each of the 5 cats in a pet store was weighed. Here are their weights (in pounds). 13, 12, 5, 12, 9 Find the median and mean weights of these cats. If necessary, round your answers to the nearest tenth. (a) Median: pounds X Ś ? (b) Mean: poundsarrow_forwardBelow is a histogram of the tuition and fee charges for 64 four-year colleges in Massachusetts. What is the number of universities/colleges with tuition and fee charges covered by the leftmost bar in the histogram.arrow_forwardI can't understand why the data is the percentage of surveyed parents.arrow_forward
- Find the 5-number summary for the data shown 23 51 52 56 60 67 76 89 92 94 5 number summary:Find the lower fence: Find the upper fencearrow_forwardFind the mean for the list of numbers. Ages of patients (in years ) in a clinic: 15, 4, 22, 15 Round answer to the nearest whole number if necessary.arrow_forwardFind the 5 number summary for the data shown 3 34 38 41 43 66 70 71 81 83 100 5 number summary:arrow_forward
arrow_back_ios
SEE MORE QUESTIONS
arrow_forward_ios
Recommended textbooks for you
 MATLAB: An Introduction with ApplicationsStatisticsISBN:9781119256830Author:Amos GilatPublisher:John Wiley & Sons Inc
 Probability and Statistics for Engineering and th...StatisticsISBN:9781305251809Author:Jay L. DevorePublisher:Cengage Learning
 Statistics for The Behavioral Sciences (MindTap C...StatisticsISBN:9781305504912Author:Frederick J Gravetter, Larry B. WallnauPublisher:Cengage Learning
 Elementary Statistics: Picturing the World (7th E...StatisticsISBN:9780134683416Author:Ron Larson, Betsy FarberPublisher:PEARSON
 The Basic Practice of StatisticsStatisticsISBN:9781319042578Author:David S. Moore, William I. Notz, Michael A. FlignerPublisher:W. H. Freeman
 Introduction to the Practice of StatisticsStatisticsISBN:9781319013387Author:David S. Moore, George P. McCabe, Bruce A. CraigPublisher:W. H. Freeman

MATLAB: An Introduction with Applications
Statistics
ISBN:9781119256830
Author:Amos Gilat
Publisher:John Wiley & Sons Inc

Probability and Statistics for Engineering and th...
Statistics
ISBN:9781305251809
Author:Jay L. Devore
Publisher:Cengage Learning

Statistics for The Behavioral Sciences (MindTap C...
Statistics
ISBN:9781305504912
Author:Frederick J Gravetter, Larry B. Wallnau
Publisher:Cengage Learning

Elementary Statistics: Picturing the World (7th E...
Statistics
ISBN:9780134683416
Author:Ron Larson, Betsy Farber
Publisher:PEARSON

The Basic Practice of Statistics
Statistics
ISBN:9781319042578
Author:David S. Moore, William I. Notz, Michael A. Fligner
Publisher:W. H. Freeman

Introduction to the Practice of Statistics
Statistics
ISBN:9781319013387
Author:David S. Moore, George P. McCabe, Bruce A. Craig
Publisher:W. H. Freeman