
MATLAB: An Introduction with Applications
6th Edition
ISBN: 9781119256830
Author: Amos Gilat
Publisher: John Wiley & Sons Inc
expand_more
expand_more
format_list_bulleted
Related questions
Concept explainers
Topic Video
Question
The scores of a test for an engineering class of 30 students are shown here. Organize the data in a manner similar to Table 19.1 and
use Excel to create a histogram.
Scores: 57, 94, 81, 77, 66, 97, 62, 86, 75, 87, 91, 78, 61, 82, 74, 72, 70, 88, 66, 75, 55, 66, 58, 73, 79, 51, 63, 77, 52, 84
Using Equations (19.7) and (19.8) , calculate the mean and standard deviation of the class scores.
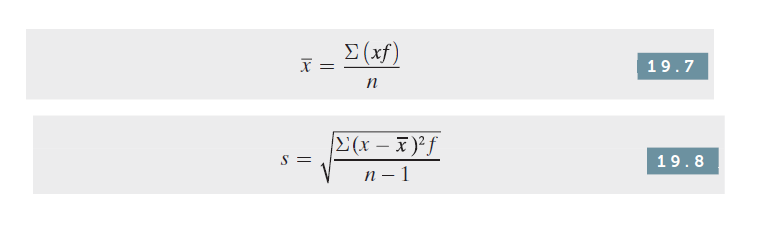

Transcribed Image Text:E (xf)
X =
19.7
n
E(x – x)²f
-
S =
19.8
п — 1

Transcribed Image Text:Grouped Frequency
Distribution for Example 19.2
TABLE 19. 1
Scores
Range
Frequency
58, 53, 56
50-59
68, 60, 62, 65, 62
60-69
75, 75, 78, 73, 70, 70, 75, 72, 79
70–79
9.
80, 85, 88, 83, 85, 87
80-89
95, 97, 90
90-99
3
3.
Expert Solution
This question has been solved!
Explore an expertly crafted, step-by-step solution for a thorough understanding of key concepts.

This is a popular solution

Trending nowThis is a popular solution!

Step by stepSolved in 3 steps with 1 images

Knowledge Booster


Learn more about
Need a deep-dive on the concept behind this application? Look no further. Learn more about this topic, statistics and related others by exploring similar questions and additional content below.Similar questions
- What is the mean of the data set comprising the numbers 7, 8, 4, 5 and 11?arrow_forwardFind the following for the data set {2, 8, 10}arrow_forwardThe following DBH values were collected from a pine plantation. Please find the population, range, mean, median and mode. 9, 10, 12, 12, 13, 11, 12, 10, 12, 11, 11, 12 Population = A Range %3D A Mean = A Median = Mode =arrow_forward
- How do I create a histogram in excel?arrow_forwardThe data set below provides the time 10 adults spent in their car traveling to and from work. Here are the results in hours: 10,3,13,9,9,12,15,14,5,13 -Find the mean of the data setarrow_forwardA local store owner is interested in finding the mean age of her customers. She randomly surveys 82 customers and records their age. Identify the population, sample, variable, type of variable, parameter, and statistic.arrow_forward
- Here are 11 numbers in sorted order. -49, -45, -42, -37, -35, -35, -28, -25, -25, -21, -19 What is the 75th percentile of this data?arrow_forwardThe midterm and final exam grades for a statistics course are provided in the data set below. Jaymes, a student in the class, scored 86 on both exams. Treat the given data sets as samples. Midterm: 80, 78, 85, 82, 79, 79, 78, 86, 80, 84, 78, 84, 80, 84, 81, 78, 81, 82, 78, 84 Final: 81, 88, 68, 69, 69 81, 82, 86, 76, 71, 72, 68, 77, 86, 68, 83, 84, 71, 81, 87 z-score for midterm: 1.857 z-score for final: 1.181 Based on the z-scores calculated above, which of Jaymes's grades is more unusual, the midterm grade or the final exam grade? Select the correct answer below: A. The absolute value of the z-score for the final exam grade is greater than for the midterm grade, so the final exam grade is more unusual. B. The absolute value of the z-score for the midterm exam grade is less than for the final grade, so the midterm grade is more unusual. C. The absolute value of the z-score for the midterm exam grade is greater than for the final grade, so the midterm grade is more…arrow_forwardDescribe the shape of the data presented: Number of students 10 9 8 87 3 2 1 0 0 Hours Spent Playing Video Games on Weekends 5 10 15 20 25arrow_forward
arrow_back_ios
SEE MORE QUESTIONS
arrow_forward_ios
Recommended textbooks for you
- MATLAB: An Introduction with ApplicationsStatisticsISBN:9781119256830Author:Amos GilatPublisher:John Wiley & Sons Inc
 Probability and Statistics for Engineering and th...StatisticsISBN:9781305251809Author:Jay L. DevorePublisher:Cengage Learning
 Statistics for The Behavioral Sciences (MindTap C...StatisticsISBN:9781305504912Author:Frederick J Gravetter, Larry B. WallnauPublisher:Cengage Learning
  Elementary Statistics: Picturing the World (7th E...StatisticsISBN:9780134683416Author:Ron Larson, Betsy FarberPublisher:PEARSON
 The Basic Practice of StatisticsStatisticsISBN:9781319042578Author:David S. Moore, William I. Notz, Michael A. FlignerPublisher:W. H. Freeman
 Introduction to the Practice of StatisticsStatisticsISBN:9781319013387Author:David S. Moore, George P. McCabe, Bruce A. CraigPublisher:W. H. Freeman
MATLAB: An Introduction with Applications
Statistics
ISBN:9781119256830
Author:Amos Gilat
Publisher:John Wiley & Sons Inc
Probability and Statistics for Engineering and th...
Statistics
ISBN:9781305251809
Author:Jay L. Devore
Publisher:Cengage Learning
Statistics for The Behavioral Sciences (MindTap C...
Statistics
ISBN:9781305504912
Author:Frederick J Gravetter, Larry B. Wallnau
Publisher:Cengage Learning
Elementary Statistics: Picturing the World (7th E...
Statistics
ISBN:9780134683416
Author:Ron Larson, Betsy Farber
Publisher:PEARSON
The Basic Practice of Statistics
Statistics
ISBN:9781319042578
Author:David S. Moore, William I. Notz, Michael A. Fligner
Publisher:W. H. Freeman
Introduction to the Practice of Statistics
Statistics
ISBN:9781319013387
Author:David S. Moore, George P. McCabe, Bruce A. Craig
Publisher:W. H. Freeman