MATLAB: An Introduction with Applications
6th Edition
ISBN: 9781119256830
Author: Amos Gilat
Publisher: John Wiley & Sons Inc
expand_more
expand_more
format_list_bulleted
Concept explainers
Topic Video
Question
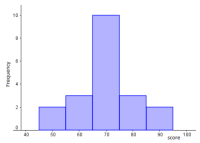
A statistics professor made the following histogram for the scores on her class’s first exam.
If a passing score is 70 or above, what percent of the students passed the exam?
50%
25%
It is impossible to determine from the histogram.
75%

Expert Solution
This question has been solved!
Explore an expertly crafted, step-by-step solution for a thorough understanding of key concepts.
This is a popular solution
Trending nowThis is a popular solution!
Step by stepSolved in 2 steps with 2 images

Knowledge Booster
Learn more about
Need a deep-dive on the concept behind this application? Look no further. Learn more about this topic, statistics and related others by exploring similar questions and additional content below.Similar questions
- 2.What percentage of data is represented by the shaded area? Enter your answer as a number, like this: 42%arrow_forwardThe test for a certain disease is 86% accurate. A hospital tests a sample of 5000 patients for this disease and the incidence rate of the disease is 12%. Fill in the following table showing the results of this disease testing. Disease No Disease Total Test Positive Test Negative Total A. What percent of these patients tests positive? Round to the nearest 0.1%. C. If a patient tests negative, what is the percent chance they have the disease? Round to the nearest 0.1% D.Suppose you select a patient at random from this sample, what is the probability the patient has the disease or tests positive? Use three significant digits.arrow_forwardWhat value corresponds to the 30th percentile?arrow_forward
- A pie chart reflects student performance... 16% As, 24% Bs, 32% Cs, 16% Ds, 12% Fs A. There were 317 students in total. How many students received As? B. If a student is selected at random what's the percentage it be a C student?arrow_forwardBelow are the summary statistics calculated from the heights of students on a university campus. 25% percent of the students were ________ inches or taller. Median: 68 inches Minimum: 50 inches Q1: 58 inches Q3: 71 inches A. 71 B. 68 C. 58 D. Cannot be determinedarrow_forwardFind the following for the data shown: 1 5 14 17 30 31 39 44 49 55 74 86 94 100 What is the percentile of the data value 44? Round to the nearest whole number. Which data value represents the 20th percentile?arrow_forward
- A social researcher wishes to know if there is a relationship between gender and perspective on the death penalty. Data has been collected on 228 persons and the results are displayed in the table below. Is there evidence of a relationship between gender and perspective on the death penalty? Gender Favor Oppose Total Male 70 42 112 Female 68 48 116 Total 138 90 228 Copy Data Step 4 of 8 : Find the value of the test statistic. Round your answer to three decimal places.arrow_forwardI can't understand why the data is the percentage of surveyed parents.arrow_forwardGiven the data set: 6, 19, 17, 23, 20, 10. Determine (i). the percentile rank for each test score,arrow_forward
- A math teacher asks each student how much time they spent studying for their last math test. She then checks each student’s overall mark. Is this case an experimental study or an observational study? 1.experimental study 2.observational studyarrow_forwardcan i get help with this too?arrow_forwardFind the 5 number summary for the data shown 17 21 29 30 36 42 56 60 88 91 94 97 5 number summary:Use the Locator/Percentile method described in your book, not your calculator.arrow_forward
arrow_back_ios
SEE MORE QUESTIONS
arrow_forward_ios
Recommended textbooks for you
 MATLAB: An Introduction with ApplicationsStatisticsISBN:9781119256830Author:Amos GilatPublisher:John Wiley & Sons Inc
 Probability and Statistics for Engineering and th...StatisticsISBN:9781305251809Author:Jay L. DevorePublisher:Cengage Learning
 Statistics for The Behavioral Sciences (MindTap C...StatisticsISBN:9781305504912Author:Frederick J Gravetter, Larry B. WallnauPublisher:Cengage Learning
 Elementary Statistics: Picturing the World (7th E...StatisticsISBN:9780134683416Author:Ron Larson, Betsy FarberPublisher:PEARSON
 The Basic Practice of StatisticsStatisticsISBN:9781319042578Author:David S. Moore, William I. Notz, Michael A. FlignerPublisher:W. H. Freeman
 Introduction to the Practice of StatisticsStatisticsISBN:9781319013387Author:David S. Moore, George P. McCabe, Bruce A. CraigPublisher:W. H. Freeman

MATLAB: An Introduction with Applications
Statistics
ISBN:9781119256830
Author:Amos Gilat
Publisher:John Wiley & Sons Inc

Probability and Statistics for Engineering and th...
Statistics
ISBN:9781305251809
Author:Jay L. Devore
Publisher:Cengage Learning

Statistics for The Behavioral Sciences (MindTap C...
Statistics
ISBN:9781305504912
Author:Frederick J Gravetter, Larry B. Wallnau
Publisher:Cengage Learning

Elementary Statistics: Picturing the World (7th E...
Statistics
ISBN:9780134683416
Author:Ron Larson, Betsy Farber
Publisher:PEARSON

The Basic Practice of Statistics
Statistics
ISBN:9781319042578
Author:David S. Moore, William I. Notz, Michael A. Fligner
Publisher:W. H. Freeman

Introduction to the Practice of Statistics
Statistics
ISBN:9781319013387
Author:David S. Moore, George P. McCabe, Bruce A. Craig
Publisher:W. H. Freeman