
MATLAB: An Introduction with Applications
6th Edition
ISBN: 9781119256830
Author: Amos Gilat
Publisher: John Wiley & Sons Inc
expand_more
expand_more
format_list_bulleted
Related questions
Question
Please answer parts 1 and 2 of the following question (not the histogram part 1, but the part where you calulate the proportion of days...) Thank you
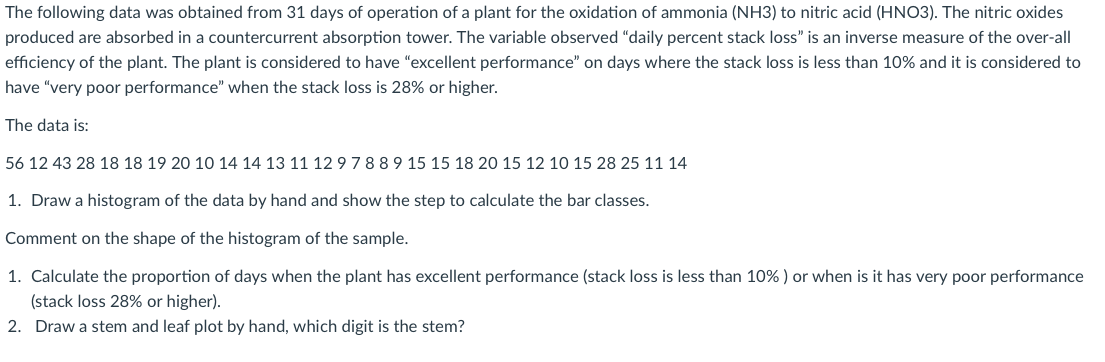

Transcribed Image Text:The following data was obtained from 31 days of operation of a plant for the oxidation of ammonia (NH3) to nitric acid (HNO3). The nitric oxides produced are absorbed in a countercurrent absorption tower. The variable observed, "daily percent stack loss," is an inverse measure of the overall efficiency of the plant. The plant is considered to have “excellent performance” on days where the stack loss is less than 10%, and it is considered to have “very poor performance” when the stack loss is 28% or higher.
The data is:
56, 12, 43, 28, 18, 18, 19, 20, 10, 14, 14, 13, 11, 12, 9, 7, 8, 8, 9, 15, 15, 18, 20, 15, 12, 10, 15, 28, 25, 11, 14
Tasks:
1. **Draw a histogram of the data by hand and show the step to calculate the bar classes.**
- Calculate the range of the dataset.
- Determine the number of classes using Sturges' Rule.
- Calculate the class width and determine class intervals.
- Plot the histogram using the frequency of data points within each class interval.
*Comment on the shape of the histogram of the sample.*
2. **Calculate the proportion of days when the plant has excellent performance (stack loss is less than 10%) or when it has very poor performance (stack loss 28% or higher).**
3. **Draw a stem-and-leaf plot by hand, which digit is the stem?**
- Use the tens digit as the stem and units digit as the leaf.
- List data points in ascending order, organizing them in the plot accordingly.
Expert Solution
This question has been solved!
Explore an expertly crafted, step-by-step solution for a thorough understanding of key concepts.

This is a popular solution

Trending nowThis is a popular solution!

Step by stepSolved in 2 steps

Knowledge Booster

Similar questions
- Clarissa has just completed her second semester in college. She earned a grade of A in her 5-hour discrete math course, a grade of C in her 1-hour sociology course, a grade of A in her 5-hour biology course, and a grade of F in her 1-hour philosophy course. Assuming that A equals 4 points, B equals 3 points, C equals 2 points, D equals 1 point, and F is worth no points, determine Clarissa's grade-point average for the semester. Clarissa's grade point average is- (Round to two decimal places as needed.) O Time Remaining: 03:23:59 Next MacBook Pro esc G Search or type URL # 24 4 5 7 8. delete 1 2 3 Y U P Q W tab G J K return A S caps lock C V shift .. .. レ の エ く6arrow_forwardThe first picture is the question and the second is the ones that I need help witharrow_forwardFor each of the variables described below, indicate whether it is a quantitative or a categorical (qualitative) variable. Also, indicate the level of measurement for the variable: nominal, ordinal, interval, or ratio. Make sure your responses are the most specific possible. Variable (a) Favorite TV game show (b) Letter grade (A, B, C, D, or F) (c) Temperature (in degrees Celsius) Type of variable O Quantitative O Categorical Quantitative Categorical Quantitative O Categorical Level of measurement O Nominal O Ordinal O Interval O Ratio O Nominal O Ordinal O Interval O Ratio O Nominal O Ordinal O Interval O Ratio x Śarrow_forward
- Question 1 Determine which of the four levels of measurement (nominal, ordinal, interval, ratio) is most appropriate. Student's grades, A, B, or C, on a test. O ratio O nominal O ordinal O intervalarrow_forwardQUESTION 9 Given the histogram below for a set of data, which statement is TRUE? A. For the set of data shown, the relationship between the mean and the median cannot be determined. B. For the set of data shown, the mean and the median are about equal. C. For the set of data shown, the mean is greater than the median. D. For the set of data shown, the median is greater than the mean. 0000arrow_forwardplease complete the blank problem and or ones with a red x next to it not ones with a green check next to pleasearrow_forward
- Need help with this Intro to Probability and Statistics homework problem. Below the homework problem is a picture of the Cereal Data in Excel that will be used for this problem. Make sure your handwriting is neat and readable.arrow_forwardPlease let me know the answer for thisarrow_forwardThree short films were selected for an award by the Historical Society of Texas. The table below shows the length Name Week 3 Assessment, Page 5 of each of the films. Film Length (minutes) 3. 1 4. 3 7 3 12 What is the difference in lengths between Film 1 and Film 3? 10 9. 16 F 8. 1 12 4:4,8216,20- = 3- 12 6. H. 4. 12 10 12arrow_forward
- Someone help please! It says I got partial credit for this frequency table but I reviewed it and I have no idea what is it I got wrong. Please double-check this for me. I think it's because of the zero on the proportion column, maybe I was supposed to put 0.00 instead of 0.0 or just 0. Please let me know thank you!arrow_forwardNext question A nurse measured the blood pressure of each person who visited her clinic. Following is a relative-frequency histogram for the systolic blood pressure readings for those people aged between 25 and 40. Use the histogram to answer the question. The blood pressure readings were given to the nearest whole number. Relative Frequency Approximately what percentage of the people aged 25-40 had a systolic blood pressure reading between 110 and 139 0.35 inclusive? 0.30 0.25 0.20 O A. 89% 0.15 0.10 B. 39% 0.05 C. 59% 0.00 100 110 120 130 140 150 160 D. 74% Systolic Blood Pressure (mm Hg)arrow_forwardattached picture 5 question explanation for number 4 pleasearrow_forward
arrow_back_ios
SEE MORE QUESTIONS
arrow_forward_ios
Recommended textbooks for you
- MATLAB: An Introduction with ApplicationsStatisticsISBN:9781119256830Author:Amos GilatPublisher:John Wiley & Sons Inc
 Probability and Statistics for Engineering and th...StatisticsISBN:9781305251809Author:Jay L. DevorePublisher:Cengage Learning
 Statistics for The Behavioral Sciences (MindTap C...StatisticsISBN:9781305504912Author:Frederick J Gravetter, Larry B. WallnauPublisher:Cengage Learning
  Elementary Statistics: Picturing the World (7th E...StatisticsISBN:9780134683416Author:Ron Larson, Betsy FarberPublisher:PEARSON
 The Basic Practice of StatisticsStatisticsISBN:9781319042578Author:David S. Moore, William I. Notz, Michael A. FlignerPublisher:W. H. Freeman
 Introduction to the Practice of StatisticsStatisticsISBN:9781319013387Author:David S. Moore, George P. McCabe, Bruce A. CraigPublisher:W. H. Freeman
MATLAB: An Introduction with Applications
Statistics
ISBN:9781119256830
Author:Amos Gilat
Publisher:John Wiley & Sons Inc
Probability and Statistics for Engineering and th...
Statistics
ISBN:9781305251809
Author:Jay L. Devore
Publisher:Cengage Learning
Statistics for The Behavioral Sciences (MindTap C...
Statistics
ISBN:9781305504912
Author:Frederick J Gravetter, Larry B. Wallnau
Publisher:Cengage Learning
Elementary Statistics: Picturing the World (7th E...
Statistics
ISBN:9780134683416
Author:Ron Larson, Betsy Farber
Publisher:PEARSON
The Basic Practice of Statistics
Statistics
ISBN:9781319042578
Author:David S. Moore, William I. Notz, Michael A. Fligner
Publisher:W. H. Freeman
Introduction to the Practice of Statistics
Statistics
ISBN:9781319013387
Author:David S. Moore, George P. McCabe, Bruce A. Craig
Publisher:W. H. Freeman