
Advanced Engineering Mathematics
10th Edition
ISBN: 9780470458365
Author: Erwin Kreyszig
Publisher: Wiley, John & Sons, Incorporated
expand_more
expand_more
format_list_bulleted
Related questions
Question
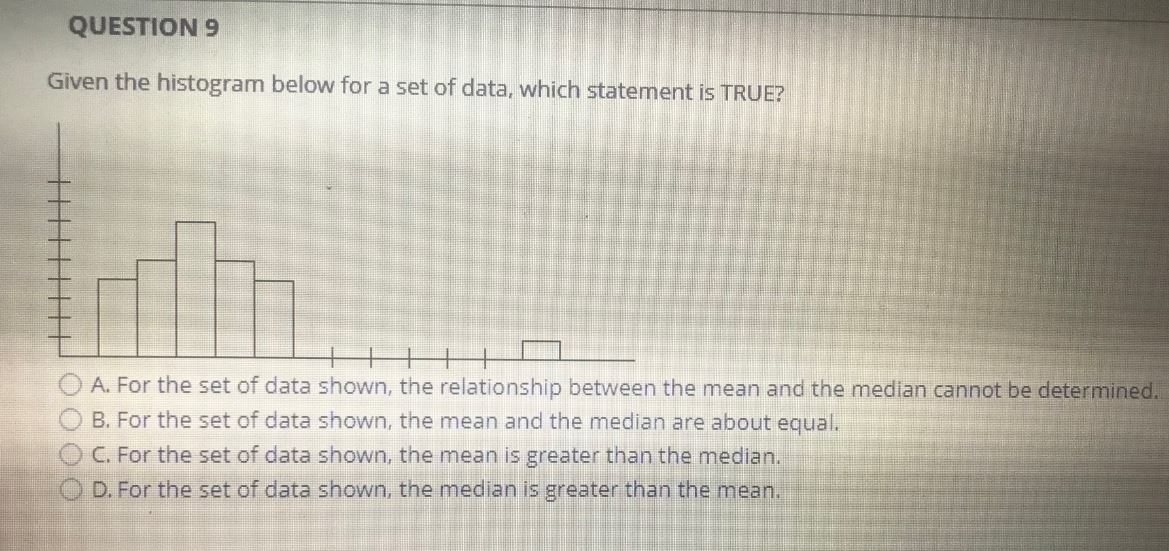

Transcribed Image Text:QUESTION 9
Given the histogram below for a set of data, which statement is TRUE?
A. For the set of data shown, the relationship between the mean and the median cannot be determined.
B. For the set of data shown, the mean and the median are about equal.
C. For the set of data shown, the mean is greater than the median.
D. For the set of data shown, the median is greater than the mean.
0000
Expert Solution
This question has been solved!
Explore an expertly crafted, step-by-step solution for a thorough understanding of key concepts.

This is a popular solution

Trending nowThis is a popular solution!

Step by stepSolved in 2 steps

Knowledge Booster

Similar questions
- A pediatrician wants to determine the relation that may exist between a child's height and head circumference. She randomly selects 8 children from her practice, measures their height and head circumference, and obtains the data shown in the table. Complete parts (a) through (e) below. Height (in.) Head Circumference (in.) O 27.25 17.5 25.25 16.9 Click here to see the Table of Critical Values for Correlation Coefficient. 26.5 17.3 25 17 28 17.6 26.25 17.2 Data Table 26.25 17.1 27.25 17.3 Critical Values for Correlation Coefficient n 3 0.997 4 0.950 0.878 0.811 7 0.754 8 0.707 0.666 10 0.632 11 0.602 12 0.576 13 0.553 14 0.532 15 0.514 16 0.497 17 0.482 18 0.468 19 0.456 20 0.444 21 0.433 22 0.423 23 0.413 24 0.404 25 0.396 26 0.388 27 0.381 28 0.374 29 0.367 30 0.361 ..... (1,1) More narrow_forwardFind a. the mean; b. the deviation from the mean for each data item; and c. the sum of the deviations in part (b) for the following group of data items. 157,158,163, 167, 170arrow_forwardThe given data set is: 9 5 23 26 11 11 Find the median. Find the mean. Round to one decimal place as needed. Find the mode. If the mode does not exist, please enter DNE. If there are multiple modes, please separate them by space and in increasing ordearrow_forward
- B. Directions: For each of the following, calculate the mean, median and mode. Show your solution. (Ungrouped data) 1. 7, 8, 9, 5, 8, 7, 7, 9, 8, 6 2. 100, 120, 132, 122, 145, 121, 105, 109, 3. 115, 119, 114, 112, 112, 109, 104, 106arrow_forward435 507 448 435 463 440 448 413 432 458 473 465 428 472 439 a. Summarize the data on femur lengths in a frequency table. Use class intervals that start at 400 and have width 20. b. Add a column to your table from part (a) for the relative frequencies. c. Draw a histogram that represents your frequency table. (Use either frequency or relative frequency for the vertical axis.)arrow_forwardWould enjoy the help. 4arrow_forward
- The table below shows the number of books the Jefferson Middle school students readeach month for nine months. If the students read only 101 books for the month of June, which measure of central tendency will have the greatest change?A. All measures will have an equal change.B. The median will have the greatest change.C. The mean will have the greatest change.D. The mode will have the greatest change.arrow_forwardWe are going to calculate the mean, median, and mode for two sets of data. Please show your answer to one decimal place if necessary. Here is the first data set. 68 71 38 27 51 47 40 66 38 97 69 a. what is the mean (T) of this data set? b. What is the median of this data set? c. What is the mode of this data set? Here is the second data set. 97 71 80 29 71 55 d. What is the mean (T) of this data set? e. What is the median of this data set? f. What is the mode of this data set? 44 76 68 56arrow_forwardWe are going to calculate the mean, median, and mode for two sets of data. Please show your answer to one decimal place if necessary. Here is the first data set. 48 78 53 22 45 42 61 97 87 22 54 a. what is the mean (T) of this data set? b. What is the median of this data set? c. What is the mode of this data set? Here is the second data set. 49 84 44 89 74 26 80 39 92 49 d. What is the mean (T) of this data set? e. What is the median of this data set? f. What is the mode of this data set?arrow_forward
arrow_back_ios
arrow_forward_ios
Recommended textbooks for you
- Advanced Engineering MathematicsAdvanced MathISBN:9780470458365Author:Erwin KreyszigPublisher:Wiley, John & Sons, Incorporated
 Numerical Methods for EngineersAdvanced MathISBN:9780073397924Author:Steven C. Chapra Dr., Raymond P. CanalePublisher:McGraw-Hill Education
 Introductory Mathematics for Engineering Applicat...Advanced MathISBN:9781118141809Author:Nathan KlingbeilPublisher:WILEY
  Mathematics For Machine TechnologyAdvanced MathISBN:9781337798310Author:Peterson, John.Publisher:Cengage Learning,

Advanced Engineering Mathematics
Advanced Math
ISBN:9780470458365
Author:Erwin Kreyszig
Publisher:Wiley, John & Sons, Incorporated
Numerical Methods for Engineers
Advanced Math
ISBN:9780073397924
Author:Steven C. Chapra Dr., Raymond P. Canale
Publisher:McGraw-Hill Education
Introductory Mathematics for Engineering Applicat...
Advanced Math
ISBN:9781118141809
Author:Nathan Klingbeil
Publisher:WILEY
Mathematics For Machine Technology
Advanced Math
ISBN:9781337798310
Author:Peterson, John.
Publisher:Cengage Learning,