
MATLAB: An Introduction with Applications
6th Edition
ISBN: 9781119256830
Author: Amos Gilat
Publisher: John Wiley & Sons Inc
expand_more
expand_more
format_list_bulleted
Related questions
Concept explainers
Topic Video
Question
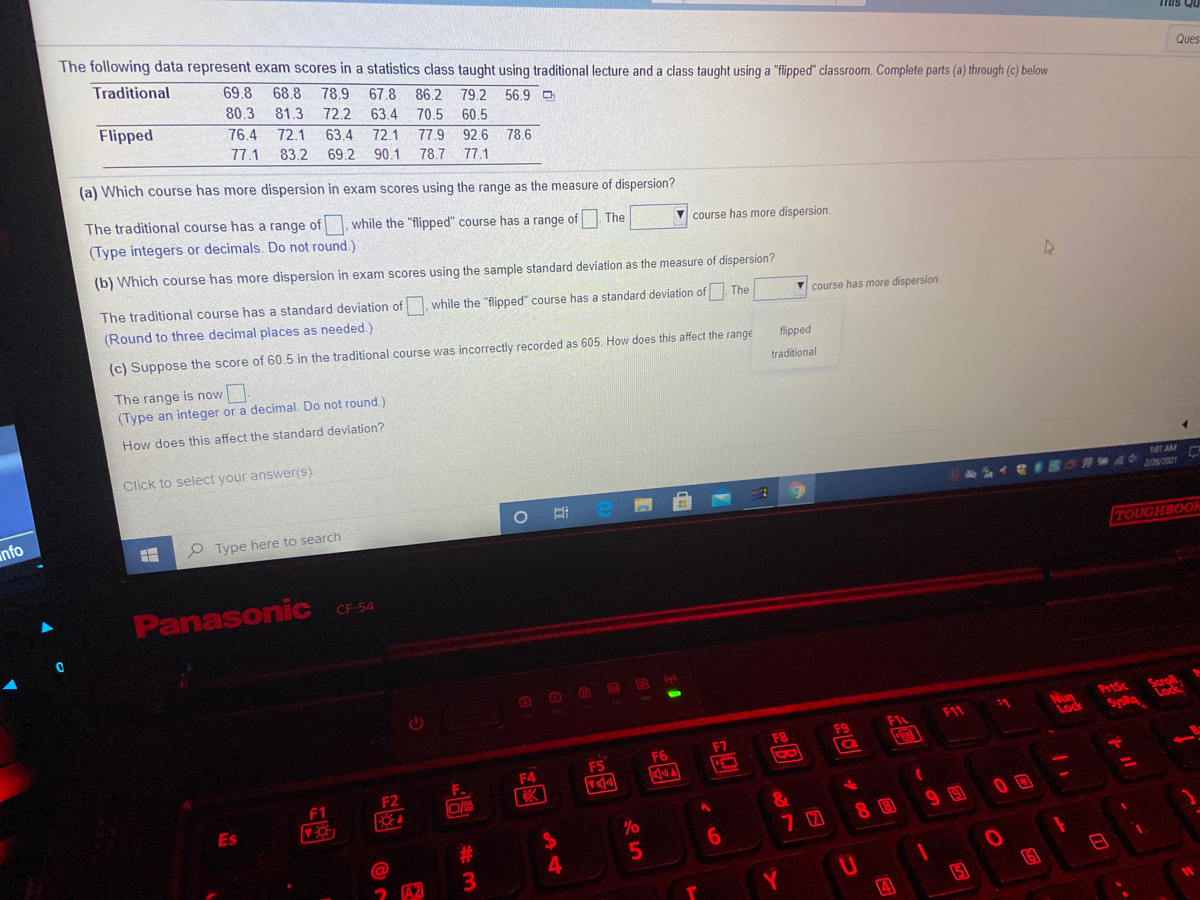

Transcribed Image Text:The following data represent exam scores in a statistics class taught using traditional lecture and a class taught using a "fipped" classroom. Complete parts (a) through (c) below.
Traditional
69.8
68.8
78.9
Ques
67.8
86.2
56.9 D
80.3
81.3
72.2
79.2
Flipped
63.4
70.5
76.4
72.1
60.5
63.4
72.1
77.9
92.6 78.6
77.1
83.2
69.2
90.1
78.7 77.1
(a) Which course has more dispersion in exam scores using the range as the measure of dispersion?
The traditional course has a range of
while the "flipped" course has a range of The
(Type integers or decimals. Do not round.)
V course has more dispersion.
(b) Which course has more dispersion in exam scores using the sample standard deviation as the measure of dispersion?
The traditional course has a standard deviation of
while the "flipped" course has a standard deviation of The
V course has more dispersion.
(Round to three decimal places as needed.)
(c) Suppose the score of 60.5 in the traditional course was incorrectly recorded as 605. How does this affect the range
flipped
traditional
The range is now
(Type an integer or a decimal. Do not round.)
How does this affect the standard deviation?
Click to select your answer(s).
101 AMO
6/2021
nfo
O Type here to search
TOUGHBOOR
PanasoniC CEF54
Scroll
Lock
PrtSc
Nun
Lock
F11
Fl
F9
byshs
F8
F6
F7
F5
F4
F2
F1
O/G
Es
7 0
8 B
#3
6
2 A2
15
4
은5

Transcribed Image Text:The following data represent exam scores in a statistics class taught using traditional lecture and a class taught using a "flipped" dlassroom. Complete parts (a) through (c) below
Traditional
69.8
68.8
78.9
67.8
86.2
79.2
56.9 D
80.3
81.3
72.2
63.4
70.5
60.5
Flipped
76.4
72.1
63.4
72.1
77.9
92.6
78.6
77.1
83.2
69.2
90.1
78.7
77.1
The range is now.
(Type an integer or a decimal. Do not round.)
How does this affect the standard deviation?
The standard deviation is now.
(Round to three decimal places as needed.)
What property does this illustrate?
O A. Neither the range nor the standard deviation is resistant.
O B. Both the range and the standard deviation are resistant.
O C. The standard deviation is resistant, but the range is not resistant.
O D. The range is resistant, but the standard deviation is not resistant.
424448
Click to select your answer(s).
P Type here to search
PanasoniC CE-54
OK
F7
F6
Expert Solution
arrow_forward
Step 1
Part a:
From the provided data for traditional class we have,
Minimum value = 56.9
Maximum value = 86.2
Thus, range = Maximum value - Minimum value = 86.2 – 56.9 = 29.3
From the provided data for flipped class we have,
Minimum value = 63.4
Maximum value = 92.6
Thus, range = Maximum value - Minimum value = 63.4- 92.6 = 29.2
The traditional course has a range of 29.3, while the flipped course has range of 29.2.
The traditional course has more dispersion.

Trending nowThis is a popular solution!

Step by stepSolved in 4 steps

Knowledge Booster


Learn more about
Need a deep-dive on the concept behind this application? Look no further. Learn more about this topic, statistics and related others by exploring similar questions and additional content below.Similar questions
- The following refer to the following data set: 81.6 127.2 98.4 100.5 95.8 106.2 127.2 108 127.2 117.8 What is the arithmetic mean of this data set? mean = What is the median of this data set? median What is the mode of this data set? mode = %3Darrow_forwardThe following data represent exam scores in a statistics class taught using traditional lecture and a class taught using a "flipped" classroom. Complete parts (a) through (c) below. Traditional 71.0 68.3 78.8 68.2 86.4 77.4 56.8 80.8 80.8 72.4 64.2 70.6 60.7 Flipped 75.5 70.5 64.3 71.5 78.0 93.2 79.5 76.2 82.4 70.4 91.6 77.2 76.9 The traditional course has a standard deviation of, while the "flipped" course has standard deviation of The traditional course has more dispersion. (Round to three decimal places as needed.)arrow_forwardwhat is the mean of the data set?arrow_forward
- The following refer to the following data set: 69.4 63.3 68.4 56.9 81.4 81.4 40.6 79.8 56 81.4 What is the arithmetic mean of this data set? mean = What is the median of this data set? median = What is the mode of this data set? mode =arrow_forwardThe following data represent exam scores in a statistics class taught using traditional lecture and a class taught using a "flipped" classroom. Complete parts (a) through (c) below. Traditional Flipped 71.6 68.3 79.7 68.2 80.5 72.3 63.9 81.1 64.1 73.3 70.6 90.4 76.6 71.5 76.0 81.6 86.3 79.1 56.1 70.1 60.4 78.4 92.9 78.9 77.8 75,8 *** (a) Which course has more dispersion in exam scores using the range as the measure of dispersion? The traditional course has a range of 30.2, while the "flipped" course has a range of 28.8. The traditional course has more dispersion. (Type integers or decimals. Do not round.) (b) Which course has more dispersion in exam scores using the sample standard deviation as the measure of dispersion? The range is now (Type an integer or a decimal. Do not round.) The traditional course has a standard deviation of 8.916, while the "flipped" course has a standard deviation of 7.692 The traditional course has more dispersion. (Round to three decimal places as needed.)…arrow_forwardHere are the weights (in pounds) of 20 teens on an experimental food diet. 174, 142, 131, 145, 175, 150, 176, 151, 110, 162, 133, 163, 135, 178, 178, 154, 166, 146, 156, 167 What is the mean of the data?arrow_forward
- A pollster wants to know the average income of those who supported John McCain for president. He asks 100 supporters and calculates a mean of $67,543. Is this mean x overbar or mu ? A. mu , because it is calculated based off data from the entire population.. B. x overbar , because it is calculated based off data from the entire population. C. mu , because it is calculated based off data from a sample. D. x overbar , because it is calculated based off data from a sample.arrow_forwardThe following data represent exam scores in a statistics class taught using traditional lecture and a class taught using a "flipped" classroom. Complete parts (a) through (c) below. Traditional 69.9 69.6 78.7 67,6 84.7 78.5 56.3 80.2 81.9 71.0 64.4 70.2 59.0 Flipped 77.5 72.5 62.7 72.6 76.9 90.4 79.6 77.4 81.9 70.5 91.3 77.8 75.7 (a) Which course has more dispersion in exam scores using the range as the measure of dispersion? The traditional course has a range of 28.4 , while the "flipped" course has a range of 28.6. The flipped course has more dispersion. (Type integers or decimals. Do not round.) (b) Which course has more dispersion in exam scores using the sample standard deviation as the measure of dispersion? The traditional course has a standard deviation of, while the "flipped" course has a standard deviation of The V course has more dispersion. (Round to three decimal places as needed.)arrow_forward
arrow_back_ios
arrow_forward_ios
Recommended textbooks for you
- MATLAB: An Introduction with ApplicationsStatisticsISBN:9781119256830Author:Amos GilatPublisher:John Wiley & Sons Inc
 Probability and Statistics for Engineering and th...StatisticsISBN:9781305251809Author:Jay L. DevorePublisher:Cengage Learning
 Statistics for The Behavioral Sciences (MindTap C...StatisticsISBN:9781305504912Author:Frederick J Gravetter, Larry B. WallnauPublisher:Cengage Learning
  Elementary Statistics: Picturing the World (7th E...StatisticsISBN:9780134683416Author:Ron Larson, Betsy FarberPublisher:PEARSON
 The Basic Practice of StatisticsStatisticsISBN:9781319042578Author:David S. Moore, William I. Notz, Michael A. FlignerPublisher:W. H. Freeman
 Introduction to the Practice of StatisticsStatisticsISBN:9781319013387Author:David S. Moore, George P. McCabe, Bruce A. CraigPublisher:W. H. Freeman
MATLAB: An Introduction with Applications
Statistics
ISBN:9781119256830
Author:Amos Gilat
Publisher:John Wiley & Sons Inc
Probability and Statistics for Engineering and th...
Statistics
ISBN:9781305251809
Author:Jay L. Devore
Publisher:Cengage Learning
Statistics for The Behavioral Sciences (MindTap C...
Statistics
ISBN:9781305504912
Author:Frederick J Gravetter, Larry B. Wallnau
Publisher:Cengage Learning
Elementary Statistics: Picturing the World (7th E...
Statistics
ISBN:9780134683416
Author:Ron Larson, Betsy Farber
Publisher:PEARSON
The Basic Practice of Statistics
Statistics
ISBN:9781319042578
Author:David S. Moore, William I. Notz, Michael A. Fligner
Publisher:W. H. Freeman
Introduction to the Practice of Statistics
Statistics
ISBN:9781319013387
Author:David S. Moore, George P. McCabe, Bruce A. Craig
Publisher:W. H. Freeman