
MATLAB: An Introduction with Applications
6th Edition
ISBN: 9781119256830
Author: Amos Gilat
Publisher: John Wiley & Sons Inc
expand_more
expand_more
format_list_bulleted
Related questions
Question

Transcribed Image Text:**Problem 5**
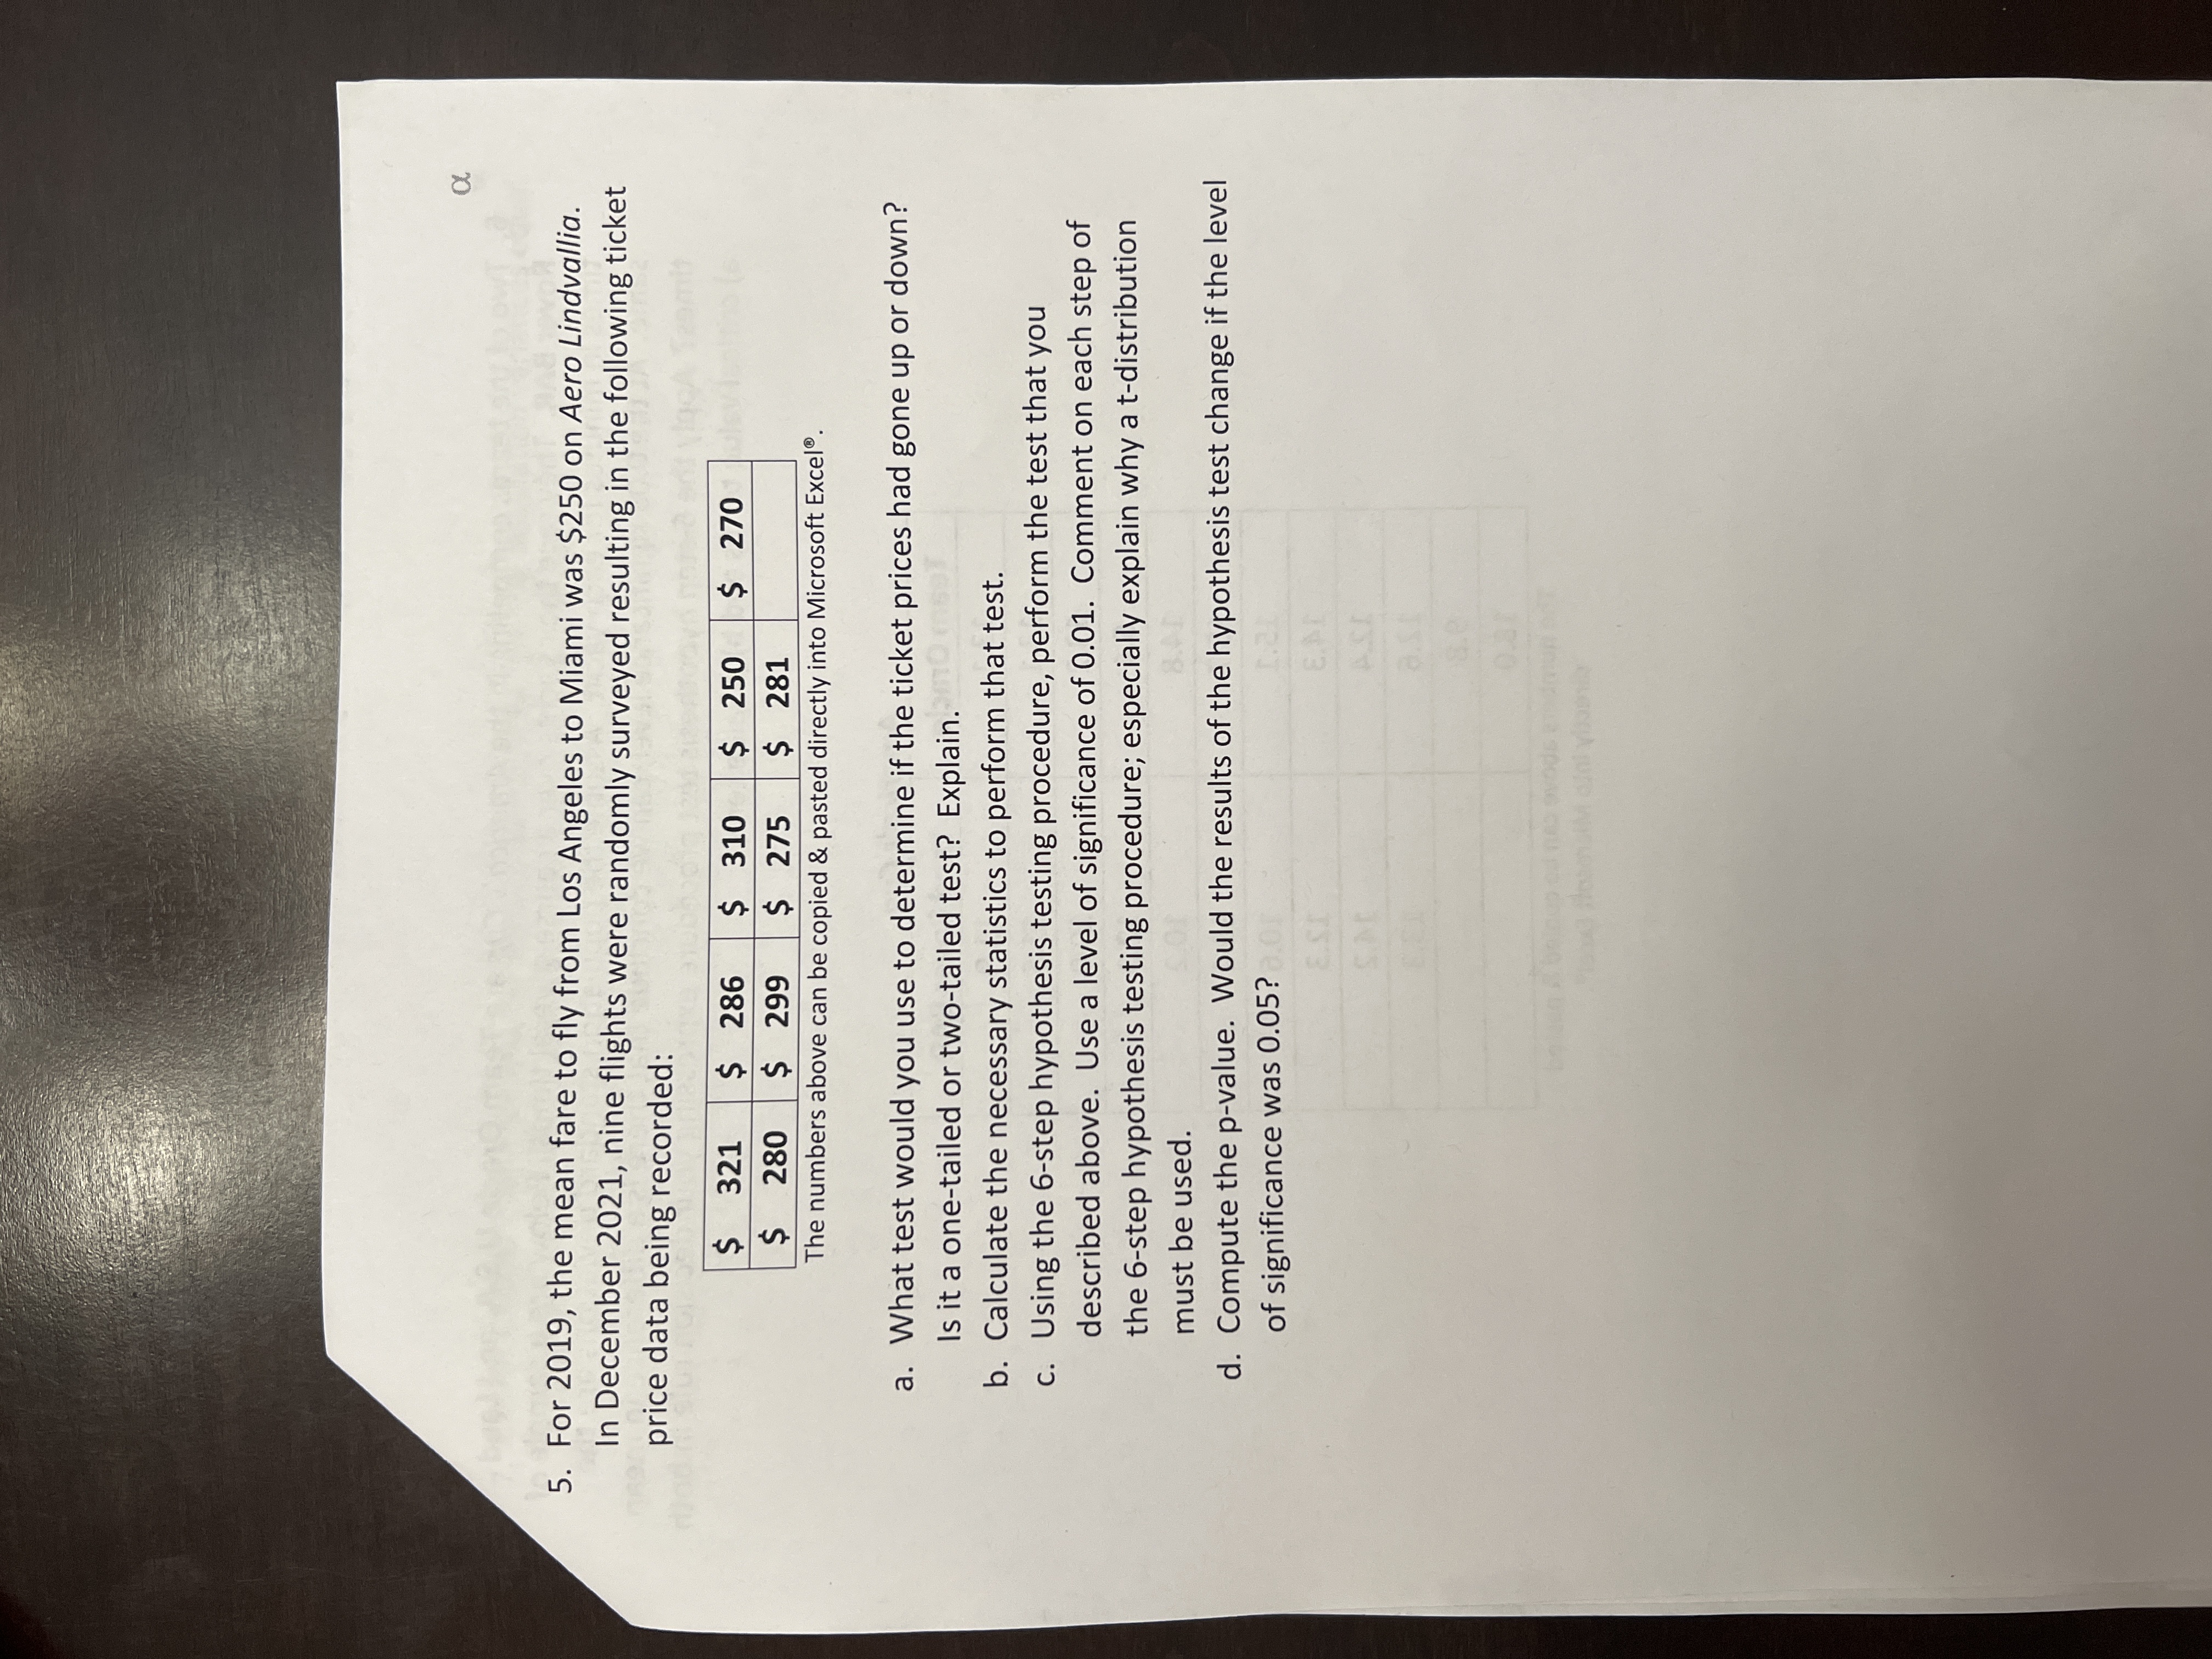
For 2019, the mean fare to fly from Los Angeles to Miami was $250 on Aero Lindvallia. In December 2021, nine flights were randomly surveyed, resulting in the following ticket price data being recorded:
- $321
- $286
- $310
- $250
- $270
- $280
- $299
- $275
- $281
*The numbers above can be copied and pasted directly into Microsoft Excel®.*
**Questions:**
a. What test would you use to determine if the ticket prices had gone up or down? Is it a one-tailed or two-tailed test? Explain.
b. Calculate the necessary statistics to perform that test.
c. Using the 6-step hypothesis testing procedure, perform the test that you described above. Use a level of significance of 0.01. Comment on each step of the 6-step hypothesis testing procedure; especially explain why a t-distribution must be used.
d. Compute the p-value. Would the results of the hypothesis test change if the level of significance was 0.05?
Expert Solution
This question has been solved!
Explore an expertly crafted, step-by-step solution for a thorough understanding of key concepts.

This is a popular solution

Trending nowThis is a popular solution!

Step by stepSolved in 2 steps with 2 images

Knowledge Booster

Similar questions
- Eight movies based on Marvel comic book characters for the U.S. box office as of fall 2017 are shown in the accompanying table, with domestic gross rounded to the nearest million. Find and interpret the median domestic gross of the top five of these eight Marvel movies.arrow_forwardEach year America.EDU ranks the best paying college degrees in America. The following data show the median starting salary, the mid-career salary, and the percentage increase from starting salary to mid-career salary for the 20 college degrees with the highest mid-career salary (America.EDU website, August 29, 2013). Click on the datafile logo to reference the data. Degree Starting Salary Mid-Salary % Aerospace Eng 59,400 108,000 82 Applied Math 56,400 101,000 79 Biomed Eng 54,800 101,000 84 Chemical Eng 64,800 108,000 67 Civil Eng 53,500 93,400 75 Computer Eng 61,200 87,700 43 Computer Sci 56,200 97,700 74 Construction Mgmt 50,400 87,000 73 Economics 48,800 97,800 100 Electrical Eng 60,800 104,000 71 Finance 47,500 91,500 93 Government 41,500 88,300 113 Info Systems 49,300 87,100 77 Mgmt Info Sys 50,900 90,300 77 Mathematics 46,400 88,300 90 Nuclear Eng 63,900 104,000 63 Petroleum Eng 93,000 157,000 69…arrow_forwardPlease no written by hand and no emage The National Assessment for Educational Progress (NAEP) is a U.S. government organization that assesses the performance of students and schools at all levels across the United States. The following table presents the percentage of eighth-grade students who were found to be proficient in mathematics and the percentage who were found to be proficient in reading in each of the ten most populous states. Use excels to find: StatePercentage Proficient in ReadingPercentage Proficient in MathematicsCalifornia6059Texas7378New York7570Florida6668Illinois7570Pennsylvania7977Ohio7976Michigan7366Georgia6764North Carolina7173 Activities: Construct a scatterplot with reading proficiency on the horizontal axis and math proficiency on the vertical axis. Is there a linear relationship? Compute the correlation between reading proficiency and math proficiency. Is the linear association positive or negative? Weak or strong?arrow_forward
- DuPont Automotive releases a Color Popularity Report which provides the percentages of car colors in North America. The most recent report is shown in the following table.arrow_forwardCan you create a five number summary of the data set?arrow_forwardThe results of a search to find the least expensive round-trip flights to Atlanta and Salt Lake C major U.S. cities are shown in the following table. The departure date was June 20, 2012 and was June 27, 2012. Click on the datafile logo to reference the data, DATA file Round-Trip Cost ($) Departure City Atlanta Salt Lake Cit Cincinnati New York 340.10 321.60 291.60 570.10 354.60 465.60 Chicago Dae 210/Oarrow_forward
- Nikko compares the prices of a skateboard at 7 different online stores. His data is shown below. $67.50, $70.00, $102.25, $65.25, $58.75, $62.00, $68.20 13 Given this information, which statement is true? A The mean and median have the same value. B. The mean is the better measure of center than the median. CThe median is a better measure of center than the mean. D. The median is affected more by the outlier than the mean. DELLarrow_forwardGive an example of a set of data that might be better represented by the median than the mean. Explain why.arrow_forwardWhy the number of days spent in hospital is a data measured at an interval and not ordinal level?arrow_forward
arrow_back_ios
SEE MORE QUESTIONS
arrow_forward_ios
Recommended textbooks for you
- MATLAB: An Introduction with ApplicationsStatisticsISBN:9781119256830Author:Amos GilatPublisher:John Wiley & Sons Inc
 Probability and Statistics for Engineering and th...StatisticsISBN:9781305251809Author:Jay L. DevorePublisher:Cengage Learning
 Statistics for The Behavioral Sciences (MindTap C...StatisticsISBN:9781305504912Author:Frederick J Gravetter, Larry B. WallnauPublisher:Cengage Learning
  Elementary Statistics: Picturing the World (7th E...StatisticsISBN:9780134683416Author:Ron Larson, Betsy FarberPublisher:PEARSON
 The Basic Practice of StatisticsStatisticsISBN:9781319042578Author:David S. Moore, William I. Notz, Michael A. FlignerPublisher:W. H. Freeman
 Introduction to the Practice of StatisticsStatisticsISBN:9781319013387Author:David S. Moore, George P. McCabe, Bruce A. CraigPublisher:W. H. Freeman
MATLAB: An Introduction with Applications
Statistics
ISBN:9781119256830
Author:Amos Gilat
Publisher:John Wiley & Sons Inc
Probability and Statistics for Engineering and th...
Statistics
ISBN:9781305251809
Author:Jay L. Devore
Publisher:Cengage Learning
Statistics for The Behavioral Sciences (MindTap C...
Statistics
ISBN:9781305504912
Author:Frederick J Gravetter, Larry B. Wallnau
Publisher:Cengage Learning
Elementary Statistics: Picturing the World (7th E...
Statistics
ISBN:9780134683416
Author:Ron Larson, Betsy Farber
Publisher:PEARSON
The Basic Practice of Statistics
Statistics
ISBN:9781319042578
Author:David S. Moore, William I. Notz, Michael A. Fligner
Publisher:W. H. Freeman
Introduction to the Practice of Statistics
Statistics
ISBN:9781319013387
Author:David S. Moore, George P. McCabe, Bruce A. Craig
Publisher:W. H. Freeman