
MATLAB: An Introduction with Applications
6th Edition
ISBN: 9781119256830
Author: Amos Gilat
Publisher: John Wiley & Sons Inc
expand_more
expand_more
format_list_bulleted
Related questions
Question
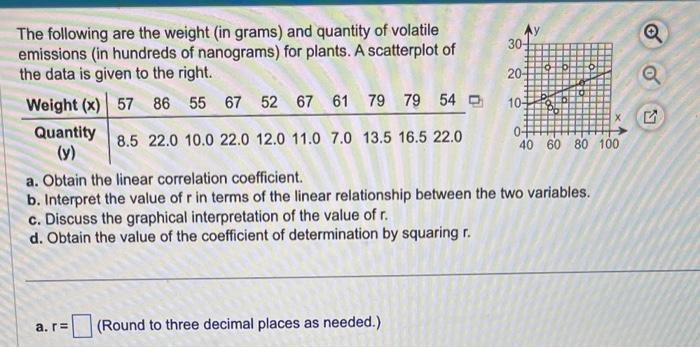

Transcribed Image Text:The following are the weight (in grams) and quantity of volatile
emissions (in hundreds of nanograms) for plants. A scatterplot of
the data is given to the right.
Weight (x) 57 86 55 67 52 67 61 79 79 54
8.5 22.0 10.0 22.0 12.0 11.0 7.0 13.5 16.5 22.0
Quantity
(y)
a. r=
Ay
30-
201
10-
a. Obtain the linear correlation coefficient.
b. Interpret the value of r in terms of the linear relationship between the two variables.
c. Discuss the graphical interpretation of the value of r.
d. Obtain the value of the coefficient of determination by squaring r.
(Round to three decimal places as needed.)
X
0+
40 60 80 100
O
O
Expert Solution
This question has been solved!
Explore an expertly crafted, step-by-step solution for a thorough understanding of key concepts.

Step by stepSolved in 2 steps

Knowledge Booster

Similar questions
- 1. Find the correlation coefficient 2. Find the p-valuearrow_forwardIt has been determined that there is a significant relationship between the temperature (x) and the number of times that a cricket chirps in a minute (y). Below is a table of values: Number of Temperature chirps 69.7 882 93.3 1188 84.3 1104 76.3 864 88.6 1200 82.6 1032 71.6 960 79.6 900arrow_forwardThe number of hours 13 students spent studying for a test and their scores on that test: Hours spent studying(x) Test score (y) 0 40 1 41 2 51 3 48 4 64 4 69 5 73 5 75 6 68 6 93 7 84 7 90 8 95 Using 5% level of significance, is there a significant relationship between hours spent studying and test score. What is the coefficient of determination? Leave answers in 4 decimal places.arrow_forward
- An investigation of the properties of bricks used to line aluminum smelter pots was published in an article. Six different commercial bricks were evaluated. The life span of a smelter pot depends on the porosity of the brick lining (the less porosity, the longer the life span); consequently, the researchers measured the apparent porosity of each brick specimen, as well as the mean pore diameter of each brick. See the table. Apparent Porosity (y). Mean Pore Diameter (x). Click the icon to view the table. Data table Mean Pore Diameter Apparent Porosity (%) (micrometers) Brick Interpret the y-intercept of the line. Choose the correct answer below. 18.7 12.0 В 18.3 9.8 O A. The y-intercept is Bo- This value has no meaning because 0 is not in the observed range of the independent variable mean pore diameter. 16.3 7.3 6.9 5.4 O B. The y-intercept is Bo: For each unit increase in mean pore diameter, the mean porosity is estimated to increase by B0- 17.2 10.9 O C. There is not enough…arrow_forwardaChen -. M Gmail YouTube Maps oscar - Google D... Translate New Tab ece Gler 2/6 100% SID: 2. A researcher is studying the relationship between various properties of wine and their taste characteristics. The histogram below shows the amount of residual sugar (sugar left after fermentation) in a collection of wines. However, one of the bars, between 3 and 5 grams per liter, is missing. 50 (47.9) (38.7) 30 10 (0.1) (0.92) (0.1) 2 10 15 Residual sugar (grams/liter) Calculate the height of the missing bar and draw it in. (Show your work below, and indicate the numerical value in parentheses above the bar.) % per gramlterarrow_forwardSuppose the correlation between height and weight for adults is +0.80. What proportion of the variability in weight can be explained by the relationship with height? A. 20% B. 36% C. 64% D. 80%arrow_forward
- Assume the correlation coefficient between advertising dollars spent and sales is .78. How much of the variability in sales is explained by the relationship between sales and advertising dollars? a. 39.16% b. 60.84% c. 78% d. 22%arrow_forwardThe following table gives the weeks of gestation and corresponding birth weights for a sample of 5 babies. Weeks of Gestation Weight (in pounds)34 4.535 636 737 8.538 9.5 Step 3 of 3 : Calculate the coefficient of determination, r2 Round your answer to three decimal places.arrow_forwardWhich of the following is the most appropriate equation to model the data? ŷ = –10.89x + 0.85 ŷ = –0.85x + 10.89 ŷ = 10.89(0.85)x ŷ = 0.85(10.89)xarrow_forward
- The number of pounds of steam used per month by a chemical plant is thought to be related to the average ambient temperature (in F) for that month. The past year's usage and temperatures are in the following table: Usage/ Month Temp. 1000 Month 21 185.79 July. 24 214.47 Aug. 32 288.03 Sept. 47 424.84 Oct. 50 454.58 Nov. 59 539.03 Dec. Jan. Feb. Mar. Apr. May June Temp. 68 74 62 50 41 30 Identify which are the independent and dependent variables. Usage/ 1000 621.55 675.06 562.03 452.93 369.95 273.98arrow_forwardFor the following example indicate the type of data involved using the following: A = nominal data B = ordinal data C = interval data 1. Number of patients with coronary pathology in nursing homes in the U.Sarrow_forwardQ1. A study was conducted to investigate the relationship between premature birth and mental development at 12 months. The infant's birth weight was used as an index of prematurity. At age 12 months, the child's mental development was recorded. The results are shown below (the weights are in pounds): Birth 4 6 7 8 Weight(x) Developmental 85 Quotients(y) 88 87 94 96 Summary: n = 5, £x=30, £x² = 190, Ey= 450, Ey² = 40590, Exy = 2728 . a. Find the least square prediction equation, y on x. b. Obtain a 95% confidence interval for the average value of y when x 6.5 (i.e., a C.I. for E(y|x= 6.5)). c. Obtain the coefficient of correlation (r) and interpret the result. d. Test the hypothesis that H, :p= 0 vs. H, : p0. Use a =0.05.arrow_forward
arrow_back_ios
SEE MORE QUESTIONS
arrow_forward_ios
Recommended textbooks for you
- MATLAB: An Introduction with ApplicationsStatisticsISBN:9781119256830Author:Amos GilatPublisher:John Wiley & Sons Inc
 Probability and Statistics for Engineering and th...StatisticsISBN:9781305251809Author:Jay L. DevorePublisher:Cengage Learning
 Statistics for The Behavioral Sciences (MindTap C...StatisticsISBN:9781305504912Author:Frederick J Gravetter, Larry B. WallnauPublisher:Cengage Learning
  Elementary Statistics: Picturing the World (7th E...StatisticsISBN:9780134683416Author:Ron Larson, Betsy FarberPublisher:PEARSON
 The Basic Practice of StatisticsStatisticsISBN:9781319042578Author:David S. Moore, William I. Notz, Michael A. FlignerPublisher:W. H. Freeman
 Introduction to the Practice of StatisticsStatisticsISBN:9781319013387Author:David S. Moore, George P. McCabe, Bruce A. CraigPublisher:W. H. Freeman
MATLAB: An Introduction with Applications
Statistics
ISBN:9781119256830
Author:Amos Gilat
Publisher:John Wiley & Sons Inc
Probability and Statistics for Engineering and th...
Statistics
ISBN:9781305251809
Author:Jay L. Devore
Publisher:Cengage Learning
Statistics for The Behavioral Sciences (MindTap C...
Statistics
ISBN:9781305504912
Author:Frederick J Gravetter, Larry B. Wallnau
Publisher:Cengage Learning
Elementary Statistics: Picturing the World (7th E...
Statistics
ISBN:9780134683416
Author:Ron Larson, Betsy Farber
Publisher:PEARSON
The Basic Practice of Statistics
Statistics
ISBN:9781319042578
Author:David S. Moore, William I. Notz, Michael A. Fligner
Publisher:W. H. Freeman
Introduction to the Practice of Statistics
Statistics
ISBN:9781319013387
Author:David S. Moore, George P. McCabe, Bruce A. Craig
Publisher:W. H. Freeman