Glencoe Algebra 1, Student Edition, 9780079039897, 0079039898, 2018
18th Edition
ISBN: 9780079039897
Author: Carter
Publisher: McGraw Hill
expand_more
expand_more
format_list_bulleted
Topic Video
Question
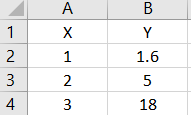
Question in attached image.

Transcribed Image Text:Homework: Consider the following data
X
1
2.
Y
1.6
18
a. Find the exponential fit
b. Calculate the correlation coefficient
3.
Expert Solution
arrow_forward
Step 1
a.
Enter the data in Excel.

Trending nowThis is a popular solution!
Step by stepSolved in 2 steps with 2 images

Knowledge Booster
Learn more about
Need a deep-dive on the concept behind this application? Look no further. Learn more about this topic, statistics and related others by exploring similar questions and additional content below.Similar questions
- A researcher finds a correlation (r) of 0.50 between height and weight. what variation in weight can be explained by the variation in height?arrow_forwardResearchers initiated a long-term study of the population of American black bears. One aspect of the study was to develop a model that could be used to predict a bear's weight (since it is not practical to weigh bears in the field). One variable thought to be related to weight is the length of the bear. The accompanying data represent the lengths and weights of 12 American black bears. Complete parts (a) through (d) below. Click the icon to view the data table. Click the icon to view the critical values table. ..... (a) Which variable is the explanatory variable based on the goals of the research? O A. The number of bears B. The weight of the bear O C. The length of the bear (b) Draw a scatter diagram of the data. Choose the correct graph below. O A. O B. O C. D. A Weight (kg) 180- AWeight (kg) 180- ALength (cm) 180- A Weight (kg) 180- 40- 100 40- 100 Length (cm) 40- 100 40- 100 200 200 200 200 Length (cm) Weight (kg) Length (cm) (c) Determine the linear correlation coefficient between…arrow_forwardData: 3.5, 3.2, 3.1, 3.5, 3.6, 3.2, 3.4, 2.9, 4.1, 2.6, 3.3, 3.5, 3.9, 3.8, 3.7, 3.4, 3.6, 3.5, 3.5, 3.7, 3.6, 3.8, 3.2, 3.4, 4.2, 3.6, 3.1, 2.9, 2.5, 3.5, 3.1, 3.2, 3.7, 3.8, 3.4, 3.6, 3.5, 3.2, 3.6, 3.8 Sketch a histogram with ranges of 0.1, from minimum (2.5) to maximum (4.2) values. Then sketch a histogram with ranges of 0.3. You can include the relative frequency scales on the same sketches.arrow_forward
- A trendline is given to depict enrollment at a local college where x is the year and y represents enrollment. Y=178.09x-353194 Use the rrendline ro estimate the enrollment for 2009. Round to the nearest whole number.arrow_forwardFind the five-number summary of the data. Be sure to include the screenshot of excel of your answers and formulas/command that you use.arrow_forwardConsider the model y=-2.45x+7.18 derived from data between x=4 and x=10. What value of x represents interpolation of the data?arrow_forward
- Suppose you have information about average heights of a random sample of airline passengers. The mode is 64 inches, the median is 73 inches, and the mean is 75 inches. To convert the data into centimeters, multiply each data value by 2.54. What are the values of the mode, median, and mean in centimeters? (Enter your answers to two decimal places.)arrow_forwardFind sd.The differences between two sets of dependent data are 0.4, 0.24, 0.22, 0.26, 0.34. Round to the nearest hundredth.arrow_forwardA regression was run to determine if there is a relationship between hours of TV watched per day, xx, and number of sit-ups, yy, a person can do in a minute.The results of the regression were: y=ax+b a=-0.873 b=23.593Use this to predict the number of sit-ups a person who watches 1111 hours of TV can do in a minute. Round to the nearest whole number.arrow_forward
- Suppose you have information about average heights of a random sample of airline passengers. The mode is 68 inches, the median is 69 inches, and the mean is 65 inches. To convert the data into centimeters, multiply each data value by 2.54. What are the values of the mode, median, and mean in centimeters? (Enter your answers to two decimal places.) mode = cm median = cm mean = cmarrow_forwardA regression was run to determine if there is a relationship between hours of TV watched per day, xx, and number of sit-ups, yy, a person can do in a minute.The results of the regression were: y=ax+b a=-1.017 b=23.99Use this to predict the number of sit-ups a person who watches 11 hour of TV can do in a minute. Round to the nearest whole number.arrow_forwardHelparrow_forward
arrow_back_ios
SEE MORE QUESTIONS
arrow_forward_ios
Recommended textbooks for you
 Glencoe Algebra 1, Student Edition, 9780079039897...AlgebraISBN:9780079039897Author:CarterPublisher:McGraw Hill
 Algebra: Structure And Method, Book 1AlgebraISBN:9780395977224Author:Richard G. Brown, Mary P. Dolciani, Robert H. Sorgenfrey, William L. ColePublisher:McDougal Littell
 Holt Mcdougal Larson Pre-algebra: Student Edition...AlgebraISBN:9780547587776Author:HOLT MCDOUGALPublisher:HOLT MCDOUGAL
 Big Ideas Math A Bridge To Success Algebra 1: Stu...AlgebraISBN:9781680331141Author:HOUGHTON MIFFLIN HARCOURTPublisher:Houghton Mifflin Harcourt

Glencoe Algebra 1, Student Edition, 9780079039897...
Algebra
ISBN:9780079039897
Author:Carter
Publisher:McGraw Hill

Algebra: Structure And Method, Book 1
Algebra
ISBN:9780395977224
Author:Richard G. Brown, Mary P. Dolciani, Robert H. Sorgenfrey, William L. Cole
Publisher:McDougal Littell

Holt Mcdougal Larson Pre-algebra: Student Edition...
Algebra
ISBN:9780547587776
Author:HOLT MCDOUGAL
Publisher:HOLT MCDOUGAL

Big Ideas Math A Bridge To Success Algebra 1: Stu...
Algebra
ISBN:9781680331141
Author:HOUGHTON MIFFLIN HARCOURT
Publisher:Houghton Mifflin Harcourt