
MATLAB: An Introduction with Applications
6th Edition
ISBN: 9781119256830
Author: Amos Gilat
Publisher: John Wiley & Sons Inc
expand_more
expand_more
format_list_bulleted
Related questions
Concept explainers
Question
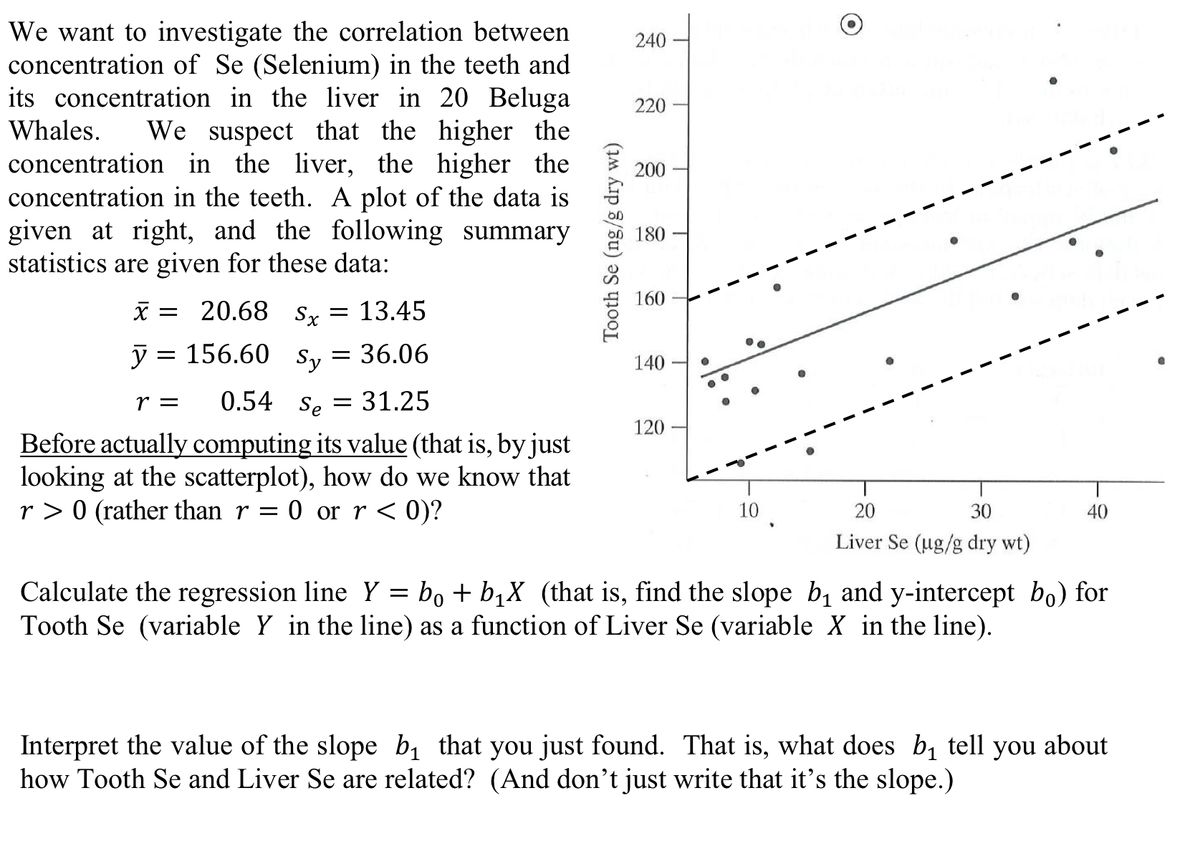

Transcribed Image Text:We want to investigate the correlation between
concentration of Se (Selenium) in the teeth and
its concentration in the liver in 20 Beluga
Whales.
240
220
We suspect that the higher the
the higher the
concentration in the liver,
concentration in the teeth. A plot of the data is
given at right, and the following summary
statistics are given for these data:
200
180
160
X = 20.68 Sy= 13.45
y =
= 156.60
Sy
= 36.06
140
0.54 Se
= 31.25
r =
120
Before actually computing its value (that is, by just
looking at the scatterplot), how do we know that
r > 0 (rather than r = 0 or r<0)?
10
20
30
40
Liver Se (ug/g dry wt)
Calculate the regression line Y = bo + bịX (that is, find the slope b, and y-intercept bo) for
Tooth Se (variable Y in the line) as a function of Liver Se (variable X in the line).
Interpret the value of the slope b, that you just found. That is, what does b, tell you about
how Tooth Se and Liver Se are related? (And don't just write that it's the slope.)
Tooth Se (ng/g dry wt)
Expert Solution
This question has been solved!
Explore an expertly crafted, step-by-step solution for a thorough understanding of key concepts.

This is a popular solution

Trending nowThis is a popular solution!

Step by stepSolved in 3 steps

Knowledge Booster


Learn more about
Need a deep-dive on the concept behind this application? Look no further. Learn more about this topic, statistics and related others by exploring similar questions and additional content below.Similar questions
- Ocean currents are important in studies of climate change, as well as ecology studies of dispersal of plankton. Drift bottles are used to study ocean currents in the Pacific near Hawaii, the Solomon Islands, New Guinea, and other islands. Let x represent the number of days to recovery of a drift bottle after release and y represent the distance from point of release to point of recovery in km/100. The following data are representative of one study using drift bottles to study ocean currents. x days y km/100 71 76 31 92 203 14.2 19.6 5.8 11.2 35.9 (a) Verify that Ex = 473, Ey = 86.7, Ex² = 61,451, Ey? 2033.69, Exy = 10995.7, and r 0.93868. %3D %3D %3D %3D %3D Σχ Ey Ex? Ey2 Σχy (b) Use a 1% level of significance to test the claim p > 0. (Use 2 decimal places.) critical t Conclusion Reject the null hypothesis, there is sufficient evidence that p > 0. Reject the null hypothesis, there is insufficient evidence that p > 0. O Fail to reject the null hypothesis, there is insufficient evidence…arrow_forwardplease use ms excelarrow_forwardThe measurements of suspended solid material concentration in water samples is illustrated in the figure below. Determine approximately the 1QR value of the data.arrow_forward
- A researcher is interested in whether the variation in the size of human beings is proportional throughout each part of the human. To partly answer this question they looked at the correlation between the foot length (in millimeters) and height (in centimeters) of 30 randomly selected adult males. The data is provided below. Use Excel to calculate the correlation coefficient r between the two data sets. Round your answer to two decimal places. Foot length (mm) Height length (cm) 269.1 188.6 245.7 177.5 272.7 166.9 271.8 155.1 273.9 144.3 274.7 133.8 255.7 122.6 276.5 157.4 279.6 145.9 280.1 135.6 281.9 123.5 HelpCopy to ClipboardDownload CSVarrow_forwardBelow, we see a snippet of a dataset that consists of 128 observations and 15 variables. We present two models describing the linear relationship between the BodyFat and other variables. Density BodyFat Age Weight Height Neck Chest Abdomen Hip Thigh Knee Ankle 1 1.0708 12.3 23 154.25 85.2 94.5 59.0 37.3 21.9 2 1.0853 6.1 22 173.25 83.0 98.7 58.7 37.3 3 1.0414 87.9 99.2 59.6 38.9 4 1.0751 86.4 101.2 5 1.0340 100.0 101.9 63.2 42.2 6 1.0502 94.4 107.8 66.0 42.0 23.4 24.0 67.75 36.2 93.1 72.25 38.5 93.6 25.3 22 154.00 66.25 34.0 95.8 10.4 26 184.75 72.25 37.4 101.8 28.7 24 184.25 71.25 34.4 97.3 20.9 24 210.25 74.75 39.0 104.5 60.1 37.3 22.8 24.0 25.6 Biceps Forearm Wrist 1 32.0 27.4 17.1 2 30.5 28.9 18.2 3 28.8 25.2 16.6 32.4 29.4 18.2 5 32.2 27.7 17.7 6 35.7 30.6 18.8 Analysis of Variance Table Model 1: x$BodyFat ~ x$Neck Model 2: x$BodyFat x$Neck + xSWeight + x$Height F Pr (>F) Res. Df RSS Df Sum of Sq 1 250 13348.1 2 248 9461.4 2 3886.7 50.939 < 2.2e-16 *** --- Signif. codes: 0***…arrow_forwardConstruct a scatter diagram using the data table to the right. This data is from a study comparing the amount of tar and carbon monoxide (CO) in cigarettes. Use tar for the horizontal scale and use carbon monoxide (CO) for the vertical scale. Determine whether there appears to be a relationship between cigarette tar and CO. Full data set D CO 15 10 со Tar 10 Tar Tar CO 16 10 2 3 9. 8 11 15 16 15 18 10 1 1 14 7 12 11 18 17 16 7 11 9. Construct a scatter diagram. ОА. В. С. ACO 20- 16 125 ACO 20- ACO 20- 163 123 83 4= ACO 20- 163 125 8- 165 125 85 8= 4= 45 Tar E 4- Tar Tar Tar 0 0 4 8 12 16 20 0- 0- 0 4 8 12 16 20 0 4 8 12 16 20 Ó 4 8 12 16 20 Is there a relationship between cigarette tar and CO? A. Yes, as the amount of tar increases the amount of carbon monoxide decreases. B. Yes, as the amount of tar increases the amount of carbon monoxide also increases. C. No, there appears to be no relationship. 出arrow_forward
- You have been hired to measure the concentration of ammonia in water from wells at two districts on Long Island. After sampling 10 wells in one of the districts you find the values are, in mg/L: 6.4, 2.1, 1.4, 0.7, 6.8, 3.2, 2.7, 1.6, 4.9, 1.2. Your assistant plots the data from the second set of wells and the histogram of data from that sample looks pretty much the same as for your data set. Which statistical test do you anticipate that you will use? An one-sample t-test An unpaired, two-sample t-test A paired, two-sample t-test A one-way anova A Mann-Whitney U test Main Contentarrow_forwardThe second slide is the first part of the question and the first slide is the second part of the questionarrow_forwardIt has been determined that there is a significant relationship between the temperature (x) and the number of times that a cricket chirps in a minute (y). Below is a table of values: Number of Temperature chirps 69.7 882 93.3 1188 84.3 1104 76.3 864 88.6 1200 82.6 1032 71.6 960 79.6 900arrow_forward
- Attachedarrow_forwardOcean currents are important in studies of climate change, as well as ecology studies of dispersal of plankton. Drift bottles are used to study ocean currents in the Pacific near Hawaii, the Solomon Islands, New Guinea, and other islands. Let x represent the number of days to recovery of a drift bottle after release and y represent the distance from point of release to point of recovery in km/100. The following data are representative of one study using drift bottles to study ocean currents. x days y km/100 71 76 31 92 203 14.2 19.6 5.8 11.2 35.9 (a) Verify that Ex = 473, Ey = 86.7, Ex = 61,451, Ey = 2033.69, Exy = 10995.7, and r 0.93868. %3D %3D %3D %3D Σχ 1 473 ΣΥ| 86.7 Ex2 61451 Ey2 2033.69 Exy 10995.7 r0.93868 (b) Use a 1% level of significance to test the claim p > 0. (Use 2 decimal places.) t 4.72 critical t 4.54 Conclusion Reject the null hypothesis, there is sufficient evidence that p > 0. O Reject the null hypothesis, there is insufficient evidence that p > 0. Fail to reject…arrow_forwardThe authors of a paper presented a correlation analysis to investigate the relationship between maximal lactate level x and muscular endurance y. The accompanying data was read from a plot in the paper. X 390 740 760 y 3.90 r 3.90 5.00 5.30 4.10 3.60 6.20 OH₂: P = 0 Ha: P 0 1,465 1,470 1,495 2,190 t = P-value = 6.98 7.45 4.85 7.70 4.55 6.70 8.80 OH₂: P = 0 H₂: P = 0 Compute the value of the sample correlation coefficient, r. (Round your answer to four decimal places.) Calculate the test statistic and determine the P-value. (Round your test statistic to one decimal place and your P-value to three decimal places.) State the conclusion in the problem context. O Fail to reject Ho. A positive correlation exists between maximum lactate level and muscular endurance. Reject Ho. A positive correlation exists between maximum lactate level and muscular endurance. O Fail to reject Ho. A positive correlation does not exist between maximum lactate level and muscular endurance. O Reject Ho. A…arrow_forward
arrow_back_ios
SEE MORE QUESTIONS
arrow_forward_ios
Recommended textbooks for you
- MATLAB: An Introduction with ApplicationsStatisticsISBN:9781119256830Author:Amos GilatPublisher:John Wiley & Sons Inc
 Probability and Statistics for Engineering and th...StatisticsISBN:9781305251809Author:Jay L. DevorePublisher:Cengage Learning
 Statistics for The Behavioral Sciences (MindTap C...StatisticsISBN:9781305504912Author:Frederick J Gravetter, Larry B. WallnauPublisher:Cengage Learning
  Elementary Statistics: Picturing the World (7th E...StatisticsISBN:9780134683416Author:Ron Larson, Betsy FarberPublisher:PEARSON
 The Basic Practice of StatisticsStatisticsISBN:9781319042578Author:David S. Moore, William I. Notz, Michael A. FlignerPublisher:W. H. Freeman
 Introduction to the Practice of StatisticsStatisticsISBN:9781319013387Author:David S. Moore, George P. McCabe, Bruce A. CraigPublisher:W. H. Freeman
MATLAB: An Introduction with Applications
Statistics
ISBN:9781119256830
Author:Amos Gilat
Publisher:John Wiley & Sons Inc
Probability and Statistics for Engineering and th...
Statistics
ISBN:9781305251809
Author:Jay L. Devore
Publisher:Cengage Learning
Statistics for The Behavioral Sciences (MindTap C...
Statistics
ISBN:9781305504912
Author:Frederick J Gravetter, Larry B. Wallnau
Publisher:Cengage Learning
Elementary Statistics: Picturing the World (7th E...
Statistics
ISBN:9780134683416
Author:Ron Larson, Betsy Farber
Publisher:PEARSON
The Basic Practice of Statistics
Statistics
ISBN:9781319042578
Author:David S. Moore, William I. Notz, Michael A. Fligner
Publisher:W. H. Freeman
Introduction to the Practice of Statistics
Statistics
ISBN:9781319013387
Author:David S. Moore, George P. McCabe, Bruce A. Craig
Publisher:W. H. Freeman