MATLAB: An Introduction with Applications
6th Edition
ISBN: 9781119256830
Author: Amos Gilat
Publisher: John Wiley & Sons Inc
expand_more
expand_more
format_list_bulleted
Concept explainers
Question
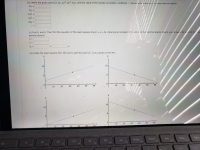
The final 2 parts of 5he question is
(e) Find the value of the coefficient of determination r2. What percentage of the variation in y can be explained by the corresponding variation in x and the least-squares line? What percentage is unexplained? (Round your answer for r2 to three decimal places. Round your answers for the percentages to one decimal place.)
|
r2 = |
|
|
explained |
% |
|
unexplained |
% |
(f) For a neighborhood with x = 30 hundred jobs, how many are predicted to be entry level jobs? (Round your answer to two decimal places.)
hundred jobs


Expert Solution
This question has been solved!
Explore an expertly crafted, step-by-step solution for a thorough understanding of key concepts.
This is a popular solution
Trending nowThis is a popular solution!
Step by stepSolved in 2 steps with 4 images

Knowledge Booster
Learn more about
Need a deep-dive on the concept behind this application? Look no further. Learn more about this topic, statistics and related others by exploring similar questions and additional content below.Similar questions
- J 2arrow_forwardMatch the coefficient of determination to the scatter diagram. The scales on the x-axis and y-axis are the same for each scatter diagram (a) R2 0.90, (b) R2 0.58, (c) R2 =1 (a) Scatter diagram Explanatory (b) Scatter diagram (c) Scatter diagram Explanatory III Explanatoryarrow_forwardneed answer and all the workarrow_forward
- One million students take a standardized test. Their average score is 500. The standard deviation of their scores is 100. A statistician chooses 400 students at random and computes the mean X of their test scores. What is the expected value of X? What is the standard deviation of X?arrow_forwardA researcher want to know if there is a relationship between sleep and anxiety. The researcher randomly selected n = 5 participants and asked each to rate their sleep quality and anxiety level on a scale of 1 to 5. The data are below: Sleep X Anxiety Y 2 2 3 3 2 2 4 2 5 2 Calculate the Sum of Squares for X (SSX)arrow_forwardTwo variables have a coefficient of determination of 0.8. Explain the significance of this value.arrow_forward
- Q1. A psychologist conducted a study on the relationship between introversion and shyness. The values are results for scales of introversion and shyness. High positive scores on each scale indicate high introversion or shyness; and high negative scores indicate low introversion or shyness. Data collected from 10 people as follows: Introversion 4 -7 -1 0 6 7 -4 -9 -5 8 Shyness 11 -7 -1 -3 0 7 -1 -8 -1 5 a) Compute the correlation coefficient relating introversion and shyness scores. b) Find the regression equation which predicts introversion from shyness. c) What introversion score would you predict from a shyness score of 7?arrow_forward11. For temperature (x) and number of ice cream cones sold per hour (y). (65, 8), (70, 10), (75, 11), (80,13), (85, 12), (90, 16). Interpret the coefficient of determination. Optional Answers: 1. 88.2% of the variability in the number of cones sold is explained by the least-squares regression model. 2. 93.9% of the variability in the number of cones sold is explained by the least-squares regression model. 3. 88.2% of the variability in the temperature is explained by the least-squares regression model. 4. 93.9% of the variability in the temperature is explained by the least-squares regression model.arrow_forwardHi could you tell me the answers?arrow_forward
arrow_back_ios
arrow_forward_ios
Recommended textbooks for you
 MATLAB: An Introduction with ApplicationsStatisticsISBN:9781119256830Author:Amos GilatPublisher:John Wiley & Sons Inc
 Probability and Statistics for Engineering and th...StatisticsISBN:9781305251809Author:Jay L. DevorePublisher:Cengage Learning
 Statistics for The Behavioral Sciences (MindTap C...StatisticsISBN:9781305504912Author:Frederick J Gravetter, Larry B. WallnauPublisher:Cengage Learning
 Elementary Statistics: Picturing the World (7th E...StatisticsISBN:9780134683416Author:Ron Larson, Betsy FarberPublisher:PEARSON
 The Basic Practice of StatisticsStatisticsISBN:9781319042578Author:David S. Moore, William I. Notz, Michael A. FlignerPublisher:W. H. Freeman
 Introduction to the Practice of StatisticsStatisticsISBN:9781319013387Author:David S. Moore, George P. McCabe, Bruce A. CraigPublisher:W. H. Freeman

MATLAB: An Introduction with Applications
Statistics
ISBN:9781119256830
Author:Amos Gilat
Publisher:John Wiley & Sons Inc

Probability and Statistics for Engineering and th...
Statistics
ISBN:9781305251809
Author:Jay L. Devore
Publisher:Cengage Learning

Statistics for The Behavioral Sciences (MindTap C...
Statistics
ISBN:9781305504912
Author:Frederick J Gravetter, Larry B. Wallnau
Publisher:Cengage Learning

Elementary Statistics: Picturing the World (7th E...
Statistics
ISBN:9780134683416
Author:Ron Larson, Betsy Farber
Publisher:PEARSON

The Basic Practice of Statistics
Statistics
ISBN:9781319042578
Author:David S. Moore, William I. Notz, Michael A. Fligner
Publisher:W. H. Freeman

Introduction to the Practice of Statistics
Statistics
ISBN:9781319013387
Author:David S. Moore, George P. McCabe, Bruce A. Craig
Publisher:W. H. Freeman