
MATLAB: An Introduction with Applications
6th Edition
ISBN: 9781119256830
Author: Amos Gilat
Publisher: John Wiley & Sons Inc
expand_more
expand_more
format_list_bulleted
Related questions
Concept explainers
Question
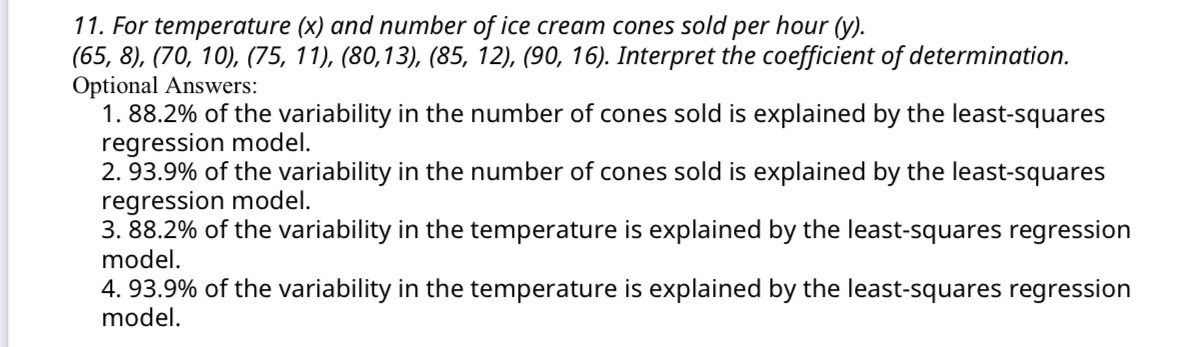

Transcribed Image Text:11. For temperature (x) and number of ice cream cones sold per hour (y).
(65, 8), (70, 10), (75, 11), (80,13), (85, 12), (90, 16). Interpret the coefficient of determination.
Optional Answers:
1. 88.2% of the variability in the number of cones sold is explained by the least-squares
regression model.
2. 93.9% of the variability in the number of cones sold is explained by the least-squares
regression model.
3. 88.2% of the variability in the temperature is explained by the least-squares regression
model.
4. 93.9% of the variability in the temperature is explained by the least-squares regression
model.
Expert Solution
arrow_forward
Step 1
From given data,
| X | Y | X*Y | X*X | Y*Y |
| 65 | 8 | 520 | 4225 | 64 |
| 70 | 10 | 700 | 4900 | 100 |
| 75 | 11 | 825 | 5625 | 121 |
| 80 | 13 | 1040 | 6400 | 169 |
| 85 | 12 | 1020 | 7225 | 144 |
| 90 | 16 | 1440 | 8100 | 256 |


Trending nowThis is a popular solution!

Step by stepSolved in 2 steps with 2 images

Knowledge Booster


Learn more about
Need a deep-dive on the concept behind this application? Look no further. Learn more about this topic, statistics and related others by exploring similar questions and additional content below.Similar questions
- I need help finding the answers for A,B,and Carrow_forwardThe data show the chest size and weight of several bears. Find the regression equation, letting chest size be the independent (x) variable. Then find the best predicted weight of a bear with a chest size of 40inches. Is the result close to the actual weight of 352pounds? Use a significance level of 0.05.a. Chest size (inches) 41 54 44 55 39 51 Weight (pounds) 328 528 418 580 296 503 a.What is the regression equation? b. The best predicted weight for a bear with a chest size of 39 inches is _______pounds. arrow_forwardThe data show the chest size and weight of several bears. Find the regression equation, letting chest size be the independent (x) variable. Then find the best predicted weight of a bear with a chest size of 58 inches. Is the result close to the actual weight of 572 pounds? Use a significance level of 0.05. Chest size (inches) 46 57 53 41 40 40 Weight (pounds) 384 580 542 358 306 320 LOADING... Click the icon to view the critical values of the Pearson correlation coefficient r. What is the regression equation? y=nothing+nothingx (Round to one decimal place as needed.)arrow_forward
- Moisture content in percent by volume (x) and conductivity in mS/m (y) were measured for 50 soil specimens. The means and standard deviations were = 8.1, sx=1.2, y = 30.4, sy=1.9. The correlation between conductivity and moisture was computed to be r= 0.810. Find the equation of the least-squares line for predicting soil conductivity from moisture content. (Round the final answers to three decimal places.) y = Xarrow_forwardwhat % of the variation is ( height, or head circumference) explained by the least-squares regression model. (Round to one decimal place as needed.)arrow_forwardo pis pe Suppose a doctor measures the height, x, and head circumference, y. of 11 children and obtains the data below. The correlation coefficient is 0.899 and the least squares regression line is y = 0.185x+ 12.276. Complete parts (a) and (b) below. Height, x Head Circumference, y 17.4 17.1 17.2 16.9 17.4 17.1 17.1 17.3 17.3 17.3 17.4 27.75 25.75 26.75 25.75 28 26.5 25.75 26.75 27 27.25 27.25 (a) Compute the coefficient of determination, R?. R2 = % (Round to one decimal place as needed) (b) Interpret the coefficient of determination k Approximately % of the variation in (Round to one decimal place as needed.) is explained by the least-squares regression model. Enter your answer in each of the answer boxes. Save for Later DUE RTTT:DY PIVT Score: o:5SYO Tor Tv attempts 3:35 PA- a 2/22/202 Type here to search insert prt sc 4+ backsp %23 6. 8.arrow_forward
- The data from the table below gives a regression that is a) reliable. b) unreliable. c) unable to determine the reliability.arrow_forwardLet x be the weight of a car (in hundreds of pounds), and let y be the miles per gallon (mpg). Suppose a car weighs 3800 pounds. What does the data forecast for the miles per gallon expected? x= 27 44 32 47 23 40 34 52 y= 30 19 24 13 29 17 21 14 State the correlation coefficient and state the regression lin equation.arrow_forwardThe equation of a regression line, unlike the correlation, depends on the units we use to measure the explanatory and response variables. Here is the data on percent body fat and preferred amount of salt. Preferred amountof salt x 0.2 0.3 0.4 0.5 0.6 0.8 1.1 Percent body fat y 20 31 22 29 39 22 30 In calculating the preferred amount of salt, the weight of the salt was in milligrams. (a) Find the equation of the regression line for predicting percent body fat from preferred amount of salt when weight is in milligrams. (Round your answers to one decimal place.) ŷ = ? + ? x (b) A mad scientist decides to measure weight in tenths of milligrams. The same data in these units are as follows. Preferred amountof salt x 2 3 4 5 6 8 11 Percent body fat y 20 31 22 29 39 22 30 Find the equation of the regression line for predicting percent body fat from preferred amount of salt when weight is in tenths of milligrams. (Round your intercept to one decimal place and your slope…arrow_forward
- You are studying how a penguin's bill length (in mm) explains its body mass (in grams) using linear regression. You choose a non-directional alternative to be safe. Given the information below, choose the formula for the least squares regression line. b₁ = 87.42 bo = 362.31 x = 43.92 y = 4202.0 O Bill Length = 87.42 Body mass + 362.31 O Bill Length = 87.42*4202.0 + 362.31 O 4202.0 = 362.31*43.92 +87.42 O Body mass = 87.42 * Bill Length + 362.31 O Body mass = 362.31 *Bill Length + 87.42 O Body mass = 362.31 43.92 + 87.42arrow_forwardThe following table presents the percentage of students who tested proficient in reading and the percentage who tested proficient in math for 5 randomly selected states in the United States. Compute the least-squares regression line for predicting math proficiency from reading proficiency. State Percent Proficientin Reading Percent Proficientin Mathematics Illinois 75 70 North Carolina 71 73 California 60 59 Georgia 67 64 Florida 66 68 Send data to Excel The equation for the least squares regression line is y = . Round the slope and y -intercept to four decimal places as needed.arrow_forwardPrev The table below gives the age and bone density for five randomly selected women. Using this data, consider the equation of the regression line, y = bo + b₁x, for predicting a woman's bone density based on her age. Keep in mind, the correlation coefficient may or may not be statistically significant for the data given. Remember, In practice, it would not be appropriate to use the regression line to make a prediction if the correlation coefficient is not statistically significant. Age Bone Density 61 62 68 69 40 357 350 343 340 315 Step 1 of 6: Find the estimated slope. Round your answer to three decimal places. Table Copy Data Nextarrow_forward
arrow_back_ios
arrow_forward_ios
Recommended textbooks for you
- MATLAB: An Introduction with ApplicationsStatisticsISBN:9781119256830Author:Amos GilatPublisher:John Wiley & Sons Inc
 Probability and Statistics for Engineering and th...StatisticsISBN:9781305251809Author:Jay L. DevorePublisher:Cengage Learning
 Statistics for The Behavioral Sciences (MindTap C...StatisticsISBN:9781305504912Author:Frederick J Gravetter, Larry B. WallnauPublisher:Cengage Learning
  Elementary Statistics: Picturing the World (7th E...StatisticsISBN:9780134683416Author:Ron Larson, Betsy FarberPublisher:PEARSON
 The Basic Practice of StatisticsStatisticsISBN:9781319042578Author:David S. Moore, William I. Notz, Michael A. FlignerPublisher:W. H. Freeman
 Introduction to the Practice of StatisticsStatisticsISBN:9781319013387Author:David S. Moore, George P. McCabe, Bruce A. CraigPublisher:W. H. Freeman
MATLAB: An Introduction with Applications
Statistics
ISBN:9781119256830
Author:Amos Gilat
Publisher:John Wiley & Sons Inc
Probability and Statistics for Engineering and th...
Statistics
ISBN:9781305251809
Author:Jay L. Devore
Publisher:Cengage Learning
Statistics for The Behavioral Sciences (MindTap C...
Statistics
ISBN:9781305504912
Author:Frederick J Gravetter, Larry B. Wallnau
Publisher:Cengage Learning
Elementary Statistics: Picturing the World (7th E...
Statistics
ISBN:9780134683416
Author:Ron Larson, Betsy Farber
Publisher:PEARSON
The Basic Practice of Statistics
Statistics
ISBN:9781319042578
Author:David S. Moore, William I. Notz, Michael A. Fligner
Publisher:W. H. Freeman
Introduction to the Practice of Statistics
Statistics
ISBN:9781319013387
Author:David S. Moore, George P. McCabe, Bruce A. Craig
Publisher:W. H. Freeman