
MATLAB: An Introduction with Applications
6th Edition
ISBN: 9781119256830
Author: Amos Gilat
Publisher: John Wiley & Sons Inc
expand_more
expand_more
format_list_bulleted
Related questions
Question
76
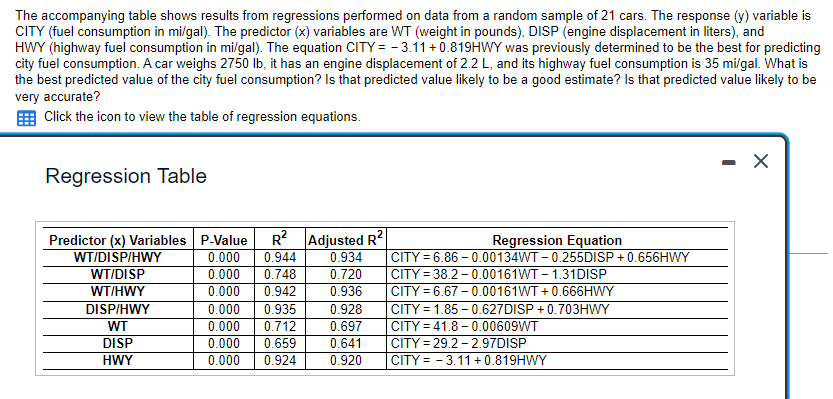

Transcribed Image Text:The accompanying table shows results from regressions performed on data from a random sample of 21 cars. The response (y) variable is
CITY (fuel consumption in mi/gal). The predictor (x) variables are WT (weight in pounds), DISP (engine displacement in liters), and
HWY (highway fuel consumption in mi/gal). The equation CITY = -3.11 +0.819HWY was previously determined to be the best for predicting
city fuel consumption. A car weighs 2750 lb, it has an engine displacement of 2.2 L, and its highway fuel consumption is 35 mi/gal. What is
the best predicted value of the city fuel consumption? Is that predicted value likely to be a good estimate? Is that predicted value likely to be
very accurate?
Click the icon to view the table of regression equations.
Regression Table
Predictor (x) Variables P-Value R² Adjusted R²
0.000 0.944
WT/DISP/HWY
0.934
0.000 0.748 0.720
0.000 0.942 0.936
0.928
0.000 0.935
0.000 0.712
0.697
0.000
0.659
0.641
CITY=29.2-2.97DISP
0.000 0.924
0.920 CITY = -3.11 +0.819HWY
WT/DISP
WT/HWY
DISP/HWY
WT
DISP
HWY
Regression Equation
CITY=6.86 -0.00134WT-0.255DISP+0.656HWY
CITY=38.2-0.00161WT-1.31DISP
| CITY=6.67 -0.00161WT+0.666HWY
CITY = 1.85-0.627DISP+0.703HWY
CITY=41.8 -0.00609WT
-
Expert Solution
This question has been solved!
Explore an expertly crafted, step-by-step solution for a thorough understanding of key concepts.

This is a popular solution

Trending nowThis is a popular solution!

Step by stepSolved in 3 steps

Knowledge Booster

Similar questions
Recommended textbooks for you
- MATLAB: An Introduction with ApplicationsStatisticsISBN:9781119256830Author:Amos GilatPublisher:John Wiley & Sons Inc
 Probability and Statistics for Engineering and th...StatisticsISBN:9781305251809Author:Jay L. DevorePublisher:Cengage Learning
 Statistics for The Behavioral Sciences (MindTap C...StatisticsISBN:9781305504912Author:Frederick J Gravetter, Larry B. WallnauPublisher:Cengage Learning
  Elementary Statistics: Picturing the World (7th E...StatisticsISBN:9780134683416Author:Ron Larson, Betsy FarberPublisher:PEARSON
 The Basic Practice of StatisticsStatisticsISBN:9781319042578Author:David S. Moore, William I. Notz, Michael A. FlignerPublisher:W. H. Freeman
 Introduction to the Practice of StatisticsStatisticsISBN:9781319013387Author:David S. Moore, George P. McCabe, Bruce A. CraigPublisher:W. H. Freeman
MATLAB: An Introduction with Applications
Statistics
ISBN:9781119256830
Author:Amos Gilat
Publisher:John Wiley & Sons Inc
Probability and Statistics for Engineering and th...
Statistics
ISBN:9781305251809
Author:Jay L. Devore
Publisher:Cengage Learning
Statistics for The Behavioral Sciences (MindTap C...
Statistics
ISBN:9781305504912
Author:Frederick J Gravetter, Larry B. Wallnau
Publisher:Cengage Learning
Elementary Statistics: Picturing the World (7th E...
Statistics
ISBN:9780134683416
Author:Ron Larson, Betsy Farber
Publisher:PEARSON
The Basic Practice of Statistics
Statistics
ISBN:9781319042578
Author:David S. Moore, William I. Notz, Michael A. Fligner
Publisher:W. H. Freeman
Introduction to the Practice of Statistics
Statistics
ISBN:9781319013387
Author:David S. Moore, George P. McCabe, Bruce A. Craig
Publisher:W. H. Freeman