Principles of Economics 2e
2nd Edition
ISBN: 9781947172364
Author: Steven A. Greenlaw; David Shapiro
Publisher: OpenStax
expand_more
expand_more
format_list_bulleted
Question

Transcribed Image Text:Consider the figure in Question 1. Suppose instead the government decides to impose a
specific (or fixed) tax of T per kg of salt, to be paid by the suppliers. Which of the following
statements is correct?
Consumers bear the entire tax burden.
The tax raised is T*Q*.
The supply curve shifts up in a parallel manner.
The new equilibrium price is P*+T.

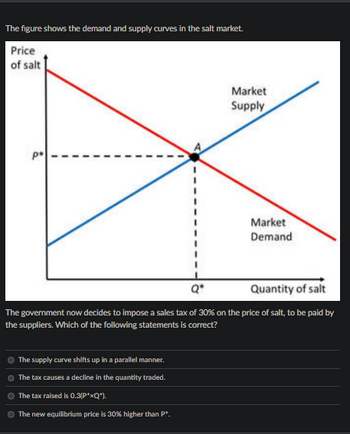
Transcribed Image Text:The figure shows the demand and supply curves in the salt market.
Price
of salt
p
Market
Supply
Q"
Market
Demand
Quantity of salt
The government now decides to impose a sales tax of 30% on the price of salt, to be paid by
the suppliers. Which of the following statements is correct?
°
The supply curve shifts up in a parallel manner.
The tax causes a decline in the quantity traded.
The tax raised is 0.3(P**Q*).
The new equilibrium price is 30% higher than P*.
0
Expert Solution
This question has been solved!
Explore an expertly crafted, step-by-step solution for a thorough understanding of key concepts.
Step by stepSolved in 2 steps

Knowledge Booster
Similar questions
- What is consumer surplus? How is it illustrated on a demand and supply diagram?arrow_forwardIn a market where the supply curve is perfectly inelastic how does an excise tax affect the price paid by consumers and the quantity bought and sold?arrow_forwardHow can you locate the equilibrium point on a demand and supply graph?arrow_forward
- Table 3.8 shows information on the demand and supply for bicycles, where the quantities of bicycles are measured in thousands. What is the quantity demanded and the quantity supplied at a price of 210? At what price is the quantity supplied equal to 48,000? Graph the demand and supply curve for bicycles. How can you determine the equilibrium price and quantity from the graph? How can you determine the equilibrium price and quantity from line table? What HIE die equilibrium price and equilibrium quantity? If the price was 120, what would the quantities demanded and supplied he? Would a shortage or surplus exist? If so, how large would the shortage or surplus he?arrow_forwardOnly typed answer and please don't use chatgpt (I)Consider the market for milk in Saskatchewan. If p is the price of milk (cents per litre) and Qis the quantity of litres (in millions per month), suppose that the demand and supply curves formilk are given by: Demand: p = 225 -15QD Supply: p = 25 + 35QS a.Assuming there is no government intervention in this market, what is the equilibrium price and quantity? Equilibrium Price = $165 Quantity = 4Liters b. Now suppose the government guarantees milk producers a price of $2 per litre and promises to buy any amount of milk that the producers cannot sell. What are the quantity demanded and quantity supplied at this guaranteed price? Please answer B.arrow_forwardThe figure belov wS supph i demand curves for bread. 45 4.0 Supply (marginal co 35 30 25 20 00 0 1 00 2.000 3,000 4000 5000 6.000 7.000 8000 9.000 10000 Quantity of loaves, Q You will not be given credit unless you provide a detailed explanation for the following questions! a) What are the equilibrium price and the equilibrium quantity in the bread market? How can you tell? Is there excess supply or excess demand in the bread market when the price of bread is 2.5 euros? Why? Explain how price, quantity demanded and quantity supplied will adjust to reach equilibrium when the price is b) 2.5 euros. Initially, the bread market is in equilibrium. Suppose that there is technological improvement in the production process of bread. Explain how supply and demand curves, equilibrium price and equilibrium quantity c) change as result.arrow_forward
- Please solve this, correct answer will appreciatearrow_forwardPlease answer C and D.arrow_forward12. Market equilibrium and disequilibrium The following graph shows the monthly demand and supply curves in the market for teapots. Use the graph input tool to help you answer the following questions. You will not be graded on any changes you make to this graph. Note: Once you enter a value in a white field, the graph and any corresponding amounts in each grey field will change accordingly. Graph Input Tool Market for Teapots 54 Supply IPrice (Dollars per teapot) 24 Quantity Demanded (Teacots) Quantity Supplied (Teapots) 600 400 42 38 30 オ 4. Demend QUANTITY Teapots arch PRICE (Dollars per teapot)arrow_forward
- Assume there is a reduction in the price of materials needed to produce computers hardwaresuch as graphic cards. Use a supply-and-demand diagram (draw a graph) to show whathappens to price, quantity, consumer surplus, producer surplus, and total surplus in themarket for computers graphic cards. And give five explanations for what had happened. Pls solve fastarrow_forwardSuppose the demand and supply curves for product TOTOM are Qd =550 – 2.5 p Qs = -125 + 4p Find the equilibrium price and quantity Graph the supply and demand curves. The current price of the product is $110, what is the quantity demanded and supplied? What you expect to happen in this market Suppose that demand changes to Qd = 550 – 3P Find the new equilibrium price and quantity and show this on grapharrow_forwardIn an economy you estimate the supply curve of milk to be Ps = 3+Q and the demand curve to be PD = 5-2Q, where Q is the millions of litres and P is price in dollars. WNhat Would be the market clearing price and what is the effect of a price ceiling of $3/Aitre? O A The market clearing price would be $2 and a price ceiling would have no impact. O B. The market clearing price would be $3.67 and a price ceiling would have no impact. O C. The market clearing price would be $3.67 and a price ceiling would induce a shortage of-1 million litres. O D. The market clearing price would be $4.33 and a price ceiling would induce a shortage of-5 million litres.arrow_forward
arrow_back_ios
SEE MORE QUESTIONS
arrow_forward_ios
Recommended textbooks for you
 Principles of Economics 2eEconomicsISBN:9781947172364Author:Steven A. Greenlaw; David ShapiroPublisher:OpenStax
 Brief Principles of Macroeconomics (MindTap Cours...EconomicsISBN:9781337091985Author:N. Gregory MankiwPublisher:Cengage Learning

 Exploring EconomicsEconomicsISBN:9781544336329Author:Robert L. SextonPublisher:SAGE Publications, Inc

Principles of Economics 2e
Economics
ISBN:9781947172364
Author:Steven A. Greenlaw; David Shapiro
Publisher:OpenStax

Brief Principles of Macroeconomics (MindTap Cours...
Economics
ISBN:9781337091985
Author:N. Gregory Mankiw
Publisher:Cengage Learning


Exploring Economics
Economics
ISBN:9781544336329
Author:Robert L. Sexton
Publisher:SAGE Publications, Inc
