
Practical Management Science
6th Edition
ISBN: 9781337406659
Author: WINSTON, Wayne L.
Publisher: Cengage,
expand_more
expand_more
format_list_bulleted
Related questions
Question
The Excel file (
Forecast Harley-Davidson quarterly motorcycle shipments for 2007 using Quadratic Trend Model
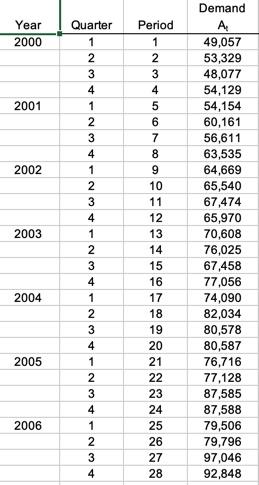

Transcribed Image Text:Demand
Year
Quarter
Period
A
2000
1
49,057
53,329
48,077
54,129
54,154
60,161
56,611
63,535
64,669
65,540
3
4
2001
6.
4
8.
2002
9.
10
11
67,474
65,970
70,608
4
12
2003
1
13
14
76,025
15
67,458
4
16
77,056
2004
1
17
74,090
18
82,034
19
80,578
4
20
80,587
2005
1
21
76,716
22
77,128
87,585
87,588
23
4
24
2006
1
25
79,506
2
26
79,796
3
27
97,046
4
28
92,848
123 41
Expert Solution
This question has been solved!
Explore an expertly crafted, step-by-step solution for a thorough understanding of key concepts.

This is a popular solution

Trending nowThis is a popular solution!

Step by stepSolved in 2 steps with 2 images

Knowledge Booster

Similar questions
- The worksheet Hudson Demand Case Data in MindTap provides the number of visits over one year from January to December (52 weeks). Chart the data and explain the characteristics of the time series. How would you forecast future demand for customer visits? What criteria will you use to determine a “good” forecast? What methods would you use, and why? What is your final recommendation with respect to a forecasting method? Note:- Do not provide handwritten solution. Maintain accuracy and quality in your answer. Take care of plagiarism. Answer completely. You will get up vote for sure.arrow_forwardMark Gershon, owner of a musical instrument distributorship, thinks that demand for guitars may be related to the number of television appearances by the popular group Maroon 5 during the previous month. Gershon has collected the data shown in the following table: Maroon 5 TV Appearances 3 3 8 5 8 6 Demand for Guitars 2 5 6 4 11 6 This exercise contains only parts b, c, and d. b) Using the least-squares regression method, the equation for forecasting is (round your responses to four decimal places): Y = + c) The estimate for guitar sales if Maroon 5 performed on TV 11times = sales (round your response to two decimal places). d) The correlation coefficient (r)for this model = (round your response to four decimal places). The coefficient of determination (r2) for this model = (round your response to…arrow_forwardThe following table shows the actual demand observed over the last 11 years: Year 1 2 3 4 5 6 7 8 9 10 11 Demand 6 8 4 7 11 7 13 12 10 13 8 This exercise contains only parts b, c, and d. Part 2 b) Using the 3-year moving average, provide the forecast from periods 4 through 12 (round your responses to one decimal place). Part 3 c) Using the 3-year weighted moving average with weights 0.10, 0.30, and 0.60, using 0.60 for the most recent period, provide the forecast from periods 4 through 12 (round your responses to two decimal places). Part 4 d) Mean absolute deviation for the forecast developed…arrow_forward
- Use exponential smoothing with trend adjustment to forecast deliveries for period 5. Let α = 0.1, β = 0.2, and let the initial trend value be 4 and the initial forecast be 200 (both are given in the table). (a) Complete the table below and to predict the demand for Period 5 (See image). Show the calculations for the demand for Period 2. (b) Based on the actual demands of the first 4 periods forecast the demand for period 5 using the linear regression method. (c) Which method performs better based on the actual demand for period 5? Why do you think so?arrow_forwardThe accompanying dataset provides data on the monthly usage of natural gas (in millions of cubic feet) for a certain region over two years. Implement the Holt-Winters multiplicative seasonality model with no trend to find the forecast for periods 13-26, where x = 0.5 and y = 0.8. Then find the MAD for periods 13-24. Click the icon to view the monthly use of natural gas data. Use the Holt-Winters multiplicative seasonality model with no trend to find the forecast for periods 13-18, periods 19-24, and then for periods 25 and 26. (Type integers or decimals rounded to two decimal places as needed.) Forecast Period 13 14 15 16 17 18 Natural Gas Usage Month Jan Feb Mar Apr May Jun Jul Aug Sep Oct Nov Dec Jan Feb Mar Apr May Jun Jul Aug Sep Oct Nov Dec Period Gas Usage 1 2 8699 A WI 3 4 5 7 9 10 11 12 13 14 1516718192021 22 23 24 241 221 155 137 54 34 29 27 30 40 90 201 229 238 242 136 34 34 28 26 27 40 86 187arrow_forwardAmazon finds that sales in July are much greater relative to other months because of the Amazon Prime days in that month. Assuming that an exponential smoothing model is used for forecasting sales, what should the company best do to make the forecast for the next month (Aug) more reflective of reality? Please pick from the provided options. F t+1 = αDt + (1-α) Ft increase value of alpha decrease value of alpha stay with the same alpha decrease the expected forecast for the current month (Ft) On hearing our forecast, our clients probe - how sure are we about the forecast? Which measure of errror (among those stated below) should we best use to respond? a. Root MSE (RMSE) b. Mean absolute percentage error (MAPE) c. Mean forecast error (Avg. error) d. Cumulative forecast error (CFE)arrow_forward
- Forecasting with Linear Regression The company VID-CO-19 has manufactured swim suits for men, women, and children for 10 years. The company is located in Boston, Massachusetts. Swim suits have always had a higher demand during the months of April, May, June, July, August, and September. The demand has always been lower during the months of October, November, December, January, February, and March. TETT The real demand, based on sales of year 20X1 is the following (it starts with December of the previous year): Period Bimester Demand Season Average December-January February-March 1 100 90 2 200 180 3 April-May June-July August-September 900 910 4 3,000 2,100 4,000 4,900 October-November 300 350 VID-CO-19 has hired you as an Operations Management expert to help them to forecast demand for year 20X2 using the Linear Regression Method. What is the TOTAL "seasonalized" or "deseasonalized' forecasted demand for Quito-Ecuador in year 20X2? (write your answer rounded to two decimals)arrow_forwardThe purpose of this assignment is to give you an opportunity to create a forecast based on data and interpret the results. You will also gain more practice with Minitab. Forecasting future commodity prices can be important for many production operations. One such commodity is the price of aluminum ($US per metric ton). For this assignment, you are asked to use Minitab to create two forecasts based upon the data provided below. First, create a one period forecast based upon a three month moving average. Second, create a one period forecast based upon exponential smoothing (using a smoothing weight of 0.95). Compare the two forecasts based upon the Mean Absolute Deviation (MAD) measure of accuracy. Interpret your results. The Data: Month Price Jan-18 2,209.73 Feb-18 2,181.79 Mar-18 2,069.24 Apr-18 2,254.69 May-18 2,299.67 Jun-18 2,237.62 Jul-18 2,082.24 Aug-18 2,051.51 Sep-18 2,026.46 Oct-18 2,029.86 Nov-18 1,938.51 Dec-18 1,920.38 Jan-19 1,853.72 Feb-19…arrow_forwardElna inc is a microwave manufacturing and distribution company based in Jakarta. The company needs to estimate production demand using the historical sales data of the last 24 months (periods).A logistics manager of the company then uses the moving average, exponential smoothing, and simple linear regression methods to determine sales forecasts for the next 12 months (Graphically illustrate the results). Provide an analysis and the results of bias, MAPE, MSE, and MAD for the forecasting decisions.Moving average is 4 month, and alfa is 0.05arrow_forward
- Harlen Industries has a simple forecasting model: Take the actual demand for the same month last year and divide that by the number of fractional weeks in that month. This gives the average weekly demand for that month. This weekly average is used as the weekly forecast for the same month this year. This technique was used to forecast eight weeks for this year, which are shown in the following tables along with the actual demand that occurred. The following eight weeks show the forecast (based on last year) and the demand that actually occurred (picture attached): Calculate the MAD and tracking signal for each week.arrow_forwardAfter using your forecasting model for six months, you decide to test it using a tracking signal. Here are the forecast and actual demands for the six-month period: PERIOD FORECAST ACTUAL May 450 500 June 500 550 July 550 400 August 600 500 September 650 675 October 700 600 Find the tracking signal of each montharrow_forwardAmong the following forecasting techniques, which one utilizes both past time period forecast and past time period actual demand to calculate the forecasted demand? Weighted Moving Average Simple Moving Average Naive Method Exponential Smoothingarrow_forward
arrow_back_ios
arrow_forward_ios
Recommended textbooks for you
- Practical Management ScienceOperations ManagementISBN:9781337406659Author:WINSTON, Wayne L.Publisher:Cengage,
 Operations ManagementOperations ManagementISBN:9781259667473Author:William J StevensonPublisher:McGraw-Hill Education
 Operations and Supply Chain Management (Mcgraw-hi...Operations ManagementISBN:9781259666100Author:F. Robert Jacobs, Richard B ChasePublisher:McGraw-Hill Education
 Purchasing and Supply Chain ManagementOperations ManagementISBN:9781285869681Author:Robert M. Monczka, Robert B. Handfield, Larry C. Giunipero, James L. PattersonPublisher:Cengage Learning
 Production and Operations Analysis, Seventh Editi...Operations ManagementISBN:9781478623069Author:Steven Nahmias, Tava Lennon OlsenPublisher:Waveland Press, Inc.
Practical Management Science
Operations Management
ISBN:9781337406659
Author:WINSTON, Wayne L.
Publisher:Cengage,
Operations Management
Operations Management
ISBN:9781259667473
Author:William J Stevenson
Publisher:McGraw-Hill Education
Operations and Supply Chain Management (Mcgraw-hi...
Operations Management
ISBN:9781259666100
Author:F. Robert Jacobs, Richard B Chase
Publisher:McGraw-Hill Education
Purchasing and Supply Chain Management
Operations Management
ISBN:9781285869681
Author:Robert M. Monczka, Robert B. Handfield, Larry C. Giunipero, James L. Patterson
Publisher:Cengage Learning
Production and Operations Analysis, Seventh Editi...
Operations Management
ISBN:9781478623069
Author:Steven Nahmias, Tava Lennon Olsen
Publisher:Waveland Press, Inc.