
MATLAB: An Introduction with Applications
6th Edition
ISBN: 9781119256830
Author: Amos Gilat
Publisher: John Wiley & Sons Inc
expand_more
expand_more
format_list_bulleted
Related questions
Question
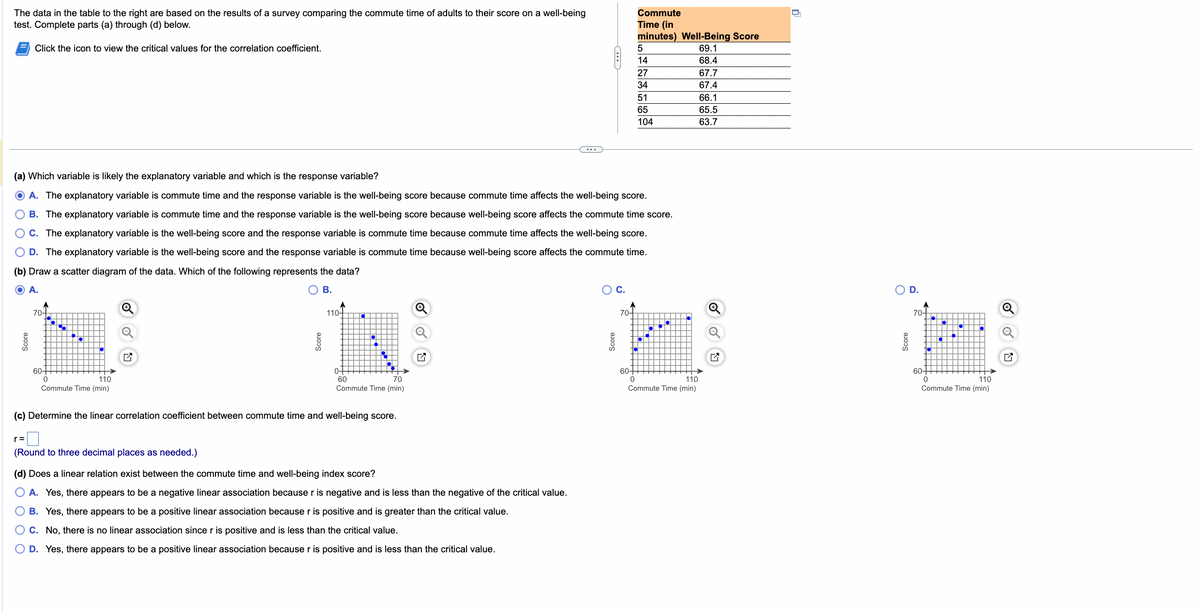

Transcribed Image Text:The data in the table to the right are based on the results of a survey comparing the commute time of adults to their score on a well-being
test. Complete parts (a) through (d) below.
Click the icon to view the critical values for the correlation coefficient.
Score
70+
r=
60-
(a) Which variable is likely the explanatory variable and which is the response variable?
A. The explanatory variable is commute time and the response variable is the well-being score because commute time affects the well-being score.
B. The explanatory variable is commute time and the response variable is the well-being score because well-being score affects the commute time score.
C. The explanatory variable is the well-being score and the response variable is commute time because commute time affects the well-being score.
D. The explanatory variable is the well-being score and the response variable is commute time because well-being score affects the commute time.
(b) Draw a scatter diagram of the data. Which of the following represents the data?
A.
B.
110
Commute Time (min)
0
Q
Score
(Round to three decimal places as needed.)
110
0-
70
Commute Time (min)
(c) Determine the linear correlation coefficient between commute time and well-being score.
60
Q
C
(d) Does a linear relation exist between the commute time and well-being index score?
A. Yes, there appears to be a negative linear association because r is negative and is less than the negative of the critical value.
B. Yes, there appears to be a positive linear association because r is positive and is greater than the critical value.
C. No, there is no linear association since r is positive and is less than the critical value.
D. Yes, there appears to be a positive linear association because r is positive and is less than the critical value.
C
O C.
Score
70+
Commute
Time (in
minutes) Well-Being Score
69.1
68.4
67.7
67.4
66.1
65.5
63.7
60+
0
5
14
27
34
51
65
104
110
Commute Time (min)
Q
O D.
Score
70-
60+
0
1
110
Commute Time (min)
Expert Solution
This question has been solved!
Explore an expertly crafted, step-by-step solution for a thorough understanding of key concepts.

Step by stepSolved in 6 steps with 8 images

Knowledge Booster

Similar questions
- ASSESSMENT Direction: Read, analyze and answer the following problems below. Show all necessary solutions. 1. The data below show the age and systolic blood pressure of six randomly selected subjects. Compute for the correlation coefficient and interpret the results. Age (x) Pressure (y) 43 48 56 61 67 70 128 120 135 143 141 152arrow_forwardK The data in the table to the right are based on the results of a survey comparing the commute time of adults to their score on a well-being test. Complete parts (a) through (d) below. Click the icon to view the table of critical values of the correlation coefficient. C (a) which variable is likely the explanatory variable and which is the response variable? Commute Time (in minutes) 4 16 23 35 48 72 98 Well-Being Score 69.2 68.4 67.2 67.1 66.5 66.1 63.8 O A. The explanatory variable is commute time and the response variable is the well-being score because well-being score affects the commute time score. OB. The explanatory variable is commute time and the response variable is the well-being score because commute time affects the well-being score. OC. The explanatory variable is the well-being score and the response variable is commute time because commute time affects the well-being score. O D. The explanatory variable is the well-being score and the response variable is commute time…arrow_forwarduse the sample data to construct a scatterplot. Use the first variable for the x-axis. Based on the scatterplot, what do you conclude about a linear correlation? FORECAST AND ACTUAL TEMPERATURES The table lists actual high temperatures and the high temperatures that were previously forecasted for these same days. The table includes data for ten different days near the author’s home. What does the result suggest about the accuracy of five-day predicted high temperatures?arrow_forward
- An electronics retailer would like to investigate the relationship between the selling price of a certain digital camera model and the demand for it. The accompanying table shows the weekly demand for the camera in one particular market along with the corresponding price. Determine the sample correlation coefficient between the selling price and the demand for this camera. Click the icon to view the demand and price data. r = (Round to three decimal places as needed.) Demand and Price Demand Price 18 320 19 330 15 340 15 350 12 360 12 370 8 380 Print Donearrow_forwardYou wish to determine if there is a linear correlation between the age of a driver and the number of driver deaths. The following table represents the age of a driver and the number of driver deaths per 100,000. Use a significance level of 0.05 and round all values to 4 decimal places. Driver Age Number of Driver Deaths per 100,000 21 22 39 21 38 18 23 22 79 36 42 22 65 29 Ho: p = 0 Ha: p= 0 Find the Linear Correlation Coefficient r = Find the p-value p-value = The p-value is O Less than (or equal to) a Greater than a The p-value leads to a decision to O Reject Ho O Accept Ho O Do Not Reject Ho The conclusion is O There is insufficient evidence to make a conclusion about the linear correlation between driver age and number of driver deaths. There is a significant linear correlation between driver age and number of driver deaths. O There is a significant negative linear correlation between driver age and number of driver deaths. O There is a significant positive linear correlation…arrow_forwardYou need to use Stata to look up the dataset and its variables. Use Stata Companion Textbook. (Dataset: NES. Variables: spend8, [pw=nesw].) The NES dataset contains spend8, which records the number of government policy areas where respondents think spending should be increased. Scores range from 0 (the respondent does not want to increase spending on any of the policies) to 8 (the respondent wants to increase spending on all eight policies). The NES, of course, polls a random sample of U.S. adults. In this exercise you will analyze spend8 using the mean and lincom commands. You then will draw inferences about the population mean. (Remember to specify nesw as the probability weight.) The spend8 variable has a sample mean of ______. Make sure you use [pw=nesw] so your results are nationally representative. There is a probability of .95 that spend8’s true population mean falls between a score of ______ at the low end and a score of ______ at the high end. A student researcher…arrow_forward
- Statistics Questionarrow_forwardev The table below gives the list price and the number of bids received for five randomly selected items sold through online auctions. Using this data, consider the equation of the regression line, y = bo + b₁x, for predicting the number of bids an item will receive based on the list price. Keep in mind, the correlation coefficient may or may not be statistically significant for the data given. Remember, in practice, it would not be appropriate to use the regression line to make a prediction if the correlation coefficient is not statistically significant. Price in Dollars 28 33 36 42 45 Number of Bids 1 7 8 9 10 Step 1 of 6: Find the estimated slope. Round your answer to three decimal places. Table Copy Data Nextarrow_forwardThe data in the table to the right are based on the results of a survey comparing the commute time of adults to their score on a well-being test. Complete parts (a) through (d) below. LOADING... Click the icon to view the table of critical values of the correlation coefficient. a) Which variable is likely the explanatory variable and which is the response variable? Critical Values for Correlation Coefficient n 3 0.997 4 0.950 5 0.878 6 0.811 7 0.754 8 0.707 9 0.666 10 0.632 11 0.602 12 0.576 13 0.553 14 0.532 15 0.514 16 0.497 17 0.482 18 0.468 19 0.456 20 0.444 21 0.433 22 0.423 23 0.413 24 0.404 25 0.396 26 0.388 27 0.381 28 0.374 29 0.367 30 0.361 n (a) Which variable is likely the explanatory variable and which is the response variable? The explanatory variable is…arrow_forward
- Let x be the average number of employees in a group health insurance plan, and let y be the average administrative cost as a percentage of claims. x 3 7 15 32 75 y 40 35 30 26 18 (a) Make a scatter diagram of the data and visualize the line you think best fits the data. Flash Player version 10 or higher is required for this question. You can get Flash Player free from Adobe's website. (b) Would you say the correlation is low, moderate, or strong? positive or negative? strong and negative moderate and negative strong and positive low and negative low and positive moderate and positive (c) Use a calculator to verify that Σx = 132, Σx2 = 6932, Σy = 149, Σy2 = 4725, and Σxy = 2997. Compute r. (Round your answer to three decimal places.)r = As x increases, does the value of r imply that y should tend to increase or decrease? Explain. Given our value of r, we cannot draw any conclusions for the behavior of y as x increases. Given our value of r, y should tend to…arrow_forwardAnswerarrow_forwardI need correlation coefficient , test statistic , p value & critical values pls help I need in one hourarrow_forward
arrow_back_ios
SEE MORE QUESTIONS
arrow_forward_ios
Recommended textbooks for you
- MATLAB: An Introduction with ApplicationsStatisticsISBN:9781119256830Author:Amos GilatPublisher:John Wiley & Sons Inc
 Probability and Statistics for Engineering and th...StatisticsISBN:9781305251809Author:Jay L. DevorePublisher:Cengage Learning
 Statistics for The Behavioral Sciences (MindTap C...StatisticsISBN:9781305504912Author:Frederick J Gravetter, Larry B. WallnauPublisher:Cengage Learning
  Elementary Statistics: Picturing the World (7th E...StatisticsISBN:9780134683416Author:Ron Larson, Betsy FarberPublisher:PEARSON
 The Basic Practice of StatisticsStatisticsISBN:9781319042578Author:David S. Moore, William I. Notz, Michael A. FlignerPublisher:W. H. Freeman
 Introduction to the Practice of StatisticsStatisticsISBN:9781319013387Author:David S. Moore, George P. McCabe, Bruce A. CraigPublisher:W. H. Freeman
MATLAB: An Introduction with Applications
Statistics
ISBN:9781119256830
Author:Amos Gilat
Publisher:John Wiley & Sons Inc
Probability and Statistics for Engineering and th...
Statistics
ISBN:9781305251809
Author:Jay L. Devore
Publisher:Cengage Learning
Statistics for The Behavioral Sciences (MindTap C...
Statistics
ISBN:9781305504912
Author:Frederick J Gravetter, Larry B. Wallnau
Publisher:Cengage Learning
Elementary Statistics: Picturing the World (7th E...
Statistics
ISBN:9780134683416
Author:Ron Larson, Betsy Farber
Publisher:PEARSON
The Basic Practice of Statistics
Statistics
ISBN:9781319042578
Author:David S. Moore, William I. Notz, Michael A. Fligner
Publisher:W. H. Freeman
Introduction to the Practice of Statistics
Statistics
ISBN:9781319013387
Author:David S. Moore, George P. McCabe, Bruce A. Craig
Publisher:W. H. Freeman