MATLAB: An Introduction with Applications
6th Edition
ISBN: 9781119256830
Author: Amos Gilat
Publisher: John Wiley & Sons Inc
expand_more
expand_more
format_list_bulleted
Question
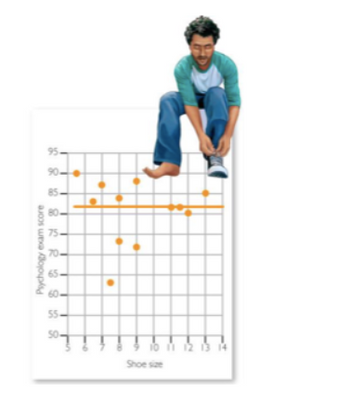
Estimate the most likely degree of
Options:
|
a.
|
-.99 |
|
b.
|
0 |
|
c.
|
.70 |
|
d.
|
.30 |

Transcribed Image Text:Psychology exam score
95.
90-
85-
80-
75.
70-
65.
60
55
50
919
10 11 12 13 14
Shoe size
Expert Solution
This question has been solved!
Explore an expertly crafted, step-by-step solution for a thorough understanding of key concepts.
Step by stepSolved in 2 steps

Knowledge Booster
Similar questions
- Q3. Give an example to distinguish the difference between: A) Qualitative and Quantitative data. B) Interval and Ratio data.arrow_forwardBelow are the summary statistics calculated from the heights of students on a university campus. 25% percent of the students were ________ inches or taller. Median: 68 inches Minimum: 50 inches Q1: 58 inches Q3: 71 inches A. 71 B. 68 C. 58 D. Cannot be determinedarrow_forwardHi, (d) was not answered so I'm posting it here. Find the mean, median, and mode for the set of data: 90 96 112 124 150 150 156 168arrow_forward
- Joselyn hopes to receive a grade of B or better in her statistics class. Currently she has scored 75, 83, and 81 on her three in-class tests and also has a homework average of 88. Her professor calculates the class grade by finding the mean of five grades: three in-class tests, the homework average and the final exam. What is the minimum score Joselyn must earn on the final exam to have a class grade (mean) of 80? A. 67 B. 95 C. 70 D. 73arrow_forwardWhich set of variables has correlation and causation? A. distance traveled and money spent on gas B. distance traveled and money spent on snacks C. distance traveled and number of drinks consumed D. distance traveled and time spent listening to musicarrow_forwardIdentify the correct statement below: a. The correlation between eye colour and salary is positive b. The correlation between shoe size and eye color is 0.45. c. The correlation between the weight of a mother and the weight of her daughter is 0.8 d. The correlation between height and weight is 2.5.arrow_forward
- Suppose that the correlation between height and IQ in children is +0.70. What proportion (or percent) of the variability in IQ can be explained by the relationship with height? Select one: a. 44% b. 51% c. 70% d. 49%arrow_forwardThe correlation between midterm and final grades for 300 students is 0.620. If 5 points are added to each midterm grade, the new r will be: a. 0.124 b. 0.57 c. 0.62 d. 0.744arrow_forwardJoan recorded the number of weeks that a patient was prescribed a medication after visiting the doctor. What is the variable in this set of data? a) the name of the doctor b) the type of medication prescribed c) the number of weeks of the prescription d) the name of the patientarrow_forward
- In analyzing the the correlation between two variables in the scatter plot, when the variable X increases, the variable Y also increases then the correlation between them is a. no correlation b. negative c. multiple correlation d. positivearrow_forwardNik and Nok played 5 games in a bowling center. Their scores are: Nik: 144 171 220 158 147 Nok: 182 165 187 142 159 Who is the better player based on mean score? Who is the more consistent player? Why?arrow_forwardWhich value of r indicates a stronger correlation: r= 0.841 or r= - 0.949? Explain your reasoning. Choose the correct answer below. O A. r= 0.841 represents a stronger correlation because -0.949 > 0.841|. B. r= - 0.949 represents a stronger correlation because -0.949|> |0.841|. C. r= - 0.949 represents a stronger correlation because 0.841 > - 0.949. D. r= 0.841 represents a stronger correlation because 0.841 > - 0.949.arrow_forward
arrow_back_ios
SEE MORE QUESTIONS
arrow_forward_ios
Recommended textbooks for you
 MATLAB: An Introduction with ApplicationsStatisticsISBN:9781119256830Author:Amos GilatPublisher:John Wiley & Sons Inc
 Probability and Statistics for Engineering and th...StatisticsISBN:9781305251809Author:Jay L. DevorePublisher:Cengage Learning
 Statistics for The Behavioral Sciences (MindTap C...StatisticsISBN:9781305504912Author:Frederick J Gravetter, Larry B. WallnauPublisher:Cengage Learning
 Elementary Statistics: Picturing the World (7th E...StatisticsISBN:9780134683416Author:Ron Larson, Betsy FarberPublisher:PEARSON
 The Basic Practice of StatisticsStatisticsISBN:9781319042578Author:David S. Moore, William I. Notz, Michael A. FlignerPublisher:W. H. Freeman
 Introduction to the Practice of StatisticsStatisticsISBN:9781319013387Author:David S. Moore, George P. McCabe, Bruce A. CraigPublisher:W. H. Freeman

MATLAB: An Introduction with Applications
Statistics
ISBN:9781119256830
Author:Amos Gilat
Publisher:John Wiley & Sons Inc

Probability and Statistics for Engineering and th...
Statistics
ISBN:9781305251809
Author:Jay L. Devore
Publisher:Cengage Learning

Statistics for The Behavioral Sciences (MindTap C...
Statistics
ISBN:9781305504912
Author:Frederick J Gravetter, Larry B. Wallnau
Publisher:Cengage Learning

Elementary Statistics: Picturing the World (7th E...
Statistics
ISBN:9780134683416
Author:Ron Larson, Betsy Farber
Publisher:PEARSON

The Basic Practice of Statistics
Statistics
ISBN:9781319042578
Author:David S. Moore, William I. Notz, Michael A. Fligner
Publisher:W. H. Freeman

Introduction to the Practice of Statistics
Statistics
ISBN:9781319013387
Author:David S. Moore, George P. McCabe, Bruce A. Craig
Publisher:W. H. Freeman