
MATLAB: An Introduction with Applications
6th Edition
ISBN: 9781119256830
Author: Amos Gilat
Publisher: John Wiley & Sons Inc
expand_more
expand_more
format_list_bulleted
Related questions
Question
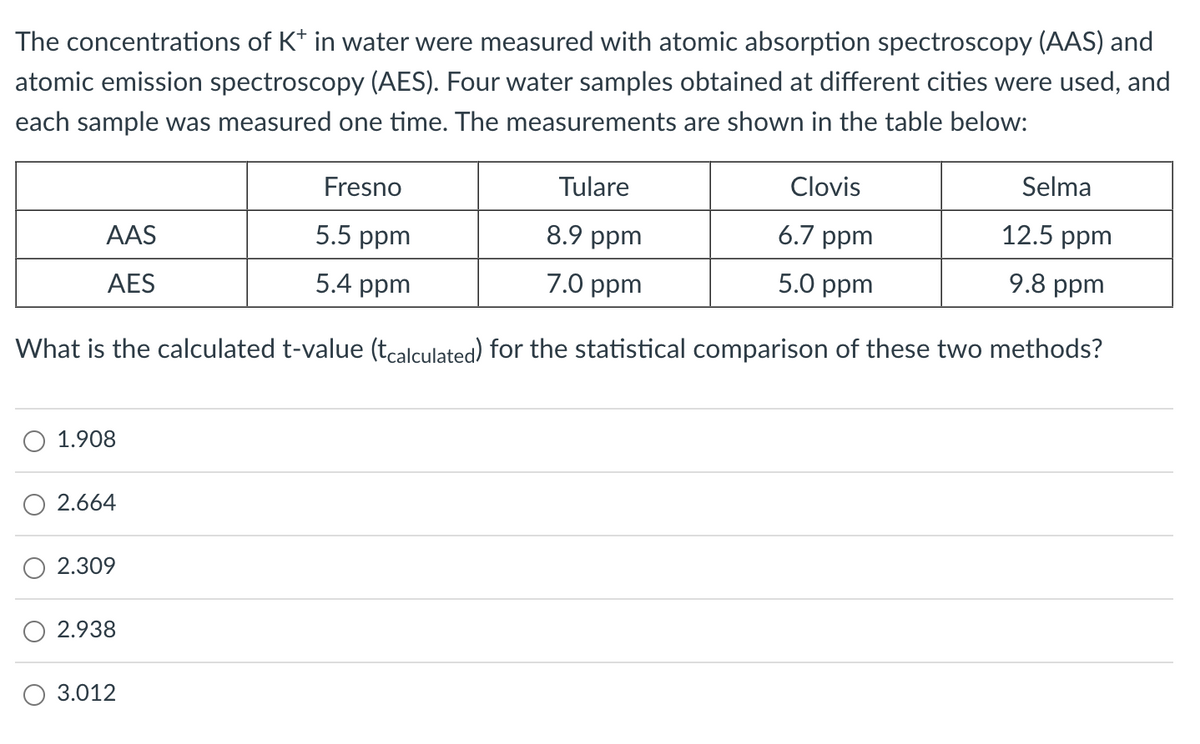

Transcribed Image Text:The concentrations of K+ in water were measured with atomic absorption spectroscopy (AAS) and
atomic emission spectroscopy (AES). Four water samples obtained at different cities were used, and
each sample was measured one time. The measurements are shown in the table below:
Clovis
6.7 ppm
5.0 ppm
What is the calculated t-value (tcalculated) for the statistical comparison of these two methods?
AAS
AES
O 1.908
2.664
2.309
2.938
3.012
Fresno
5.5 ppm
5.4 ppm
Tulare
8.9 ppm
7.0 ppm
Selma
12.5 ppm
9.8 ppm
Expert Solution
arrow_forward
Step 1
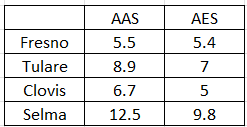
Obtained sample observations (measured in ppm) are:

Step by stepSolved in 2 steps with 2 images

Knowledge Booster

Similar questions
- Consider the following table: SS DF MS ? Among Treatments 4468.45 Error Total Step 2 of 8: Calculate the degrees of freedom among treatments. 10 706.87 15 LL Farrow_forward3. Consider a gas in a piston-cylinder device in which the temperature is held constant. As the volume of the device was changed, the pressure was meas- ured. The volume and pressure values are reported in the following table: Volume, m Pressure, kPa, when I = 300 K 1 2494 2 1247 3 831 4. 623 5 499 416 (a) Usc lincar interpolation to cstimate the pressure when the volume is 3.8 m. (b) Usc cubic spline interpolation to estimate the pressurc when the vol umc is 3.8 m'. (c) Usc lincar interpolation to cstimate the volume if the pressure is meas- urcd to be 1000 kPa. (d) Usc cubic spline interpolation to estimate the volume if the pressure is mcasured to be 1000 kPa.arrow_forwardScientists are looking at the effects of global warming on clutches of sea turtle hatchlings in different parts of the world. The data below has been collected: 1.Temperature of Incubation (in Kelvin) 2. Gender Group of Hatchling Clutch (0=0% male; 1= greater than 0% but less than or equal to 10% male; 2= greater than 10% but less than 20% male; 3= greater than 20% but less than or equal to 30% male and so on) 3. Number of hatched eggs 4. number of unhatched eggs 5. Location of Turtles (0=west North America; 1= west South America; 2= tropical regions of Pacific; 3= northwestern Atlantic; 4= Indian Ocean Which of the above variables are measured using a nominal scale, ordinal scale and ratio scale. (An answer can be none of variables) thank youarrow_forward
- Listed below are body temperatures from five different subjects measured at 8 AM and again at 12 AM. Find the values of d and sd. In general, what does μd represent? 8am 97.8 98.5 97.9 97.8 97.6 12am 98.3 99.2 98.1 97.5 98.0arrow_forward4) Blood calcium levels are measured in mg/dL. In patients over 30, μ = 9.75 mg/dL, and σ = 2.25 mg/dL. Again, use R. a) Give the blood calcium values for the middle 30% of patients. b) Give the blood calcium values for the middle 75% of patients. c) Give the 87.5th percentile.arrow_forwardA mixture of sucrose and water was heated on a hot plate, and the temperature (in °C) was recorded each minute for 20 minutes by three thermocouples. The results are shown in the following table. Time O 1 2 3 4 5 6 7 8 9 71 20 18 29 32 37 36 46 46 56 58 11 10 11231415 167 18 19 20 INR888 gege 64 72 79 84 82 87 98 103 107 103 102 T2 ON 18 22 22 25 37 46 45 44 54 64 69 65 80 74 87 93 90 100 100 103 103 T3 21 11 26 35 33 35 44 43 63 68 62 65 80 75 78 88 91 103 112 107 104 Compute the least-squares line for estimating the temperature as a function of time, using 73 as the value for temperature. (Round the ▼arrow_forward
arrow_back_ios
arrow_forward_ios
Recommended textbooks for you
- MATLAB: An Introduction with ApplicationsStatisticsISBN:9781119256830Author:Amos GilatPublisher:John Wiley & Sons Inc
 Probability and Statistics for Engineering and th...StatisticsISBN:9781305251809Author:Jay L. DevorePublisher:Cengage Learning
 Statistics for The Behavioral Sciences (MindTap C...StatisticsISBN:9781305504912Author:Frederick J Gravetter, Larry B. WallnauPublisher:Cengage Learning
  Elementary Statistics: Picturing the World (7th E...StatisticsISBN:9780134683416Author:Ron Larson, Betsy FarberPublisher:PEARSON
 The Basic Practice of StatisticsStatisticsISBN:9781319042578Author:David S. Moore, William I. Notz, Michael A. FlignerPublisher:W. H. Freeman
 Introduction to the Practice of StatisticsStatisticsISBN:9781319013387Author:David S. Moore, George P. McCabe, Bruce A. CraigPublisher:W. H. Freeman
MATLAB: An Introduction with Applications
Statistics
ISBN:9781119256830
Author:Amos Gilat
Publisher:John Wiley & Sons Inc
Probability and Statistics for Engineering and th...
Statistics
ISBN:9781305251809
Author:Jay L. Devore
Publisher:Cengage Learning
Statistics for The Behavioral Sciences (MindTap C...
Statistics
ISBN:9781305504912
Author:Frederick J Gravetter, Larry B. Wallnau
Publisher:Cengage Learning
Elementary Statistics: Picturing the World (7th E...
Statistics
ISBN:9780134683416
Author:Ron Larson, Betsy Farber
Publisher:PEARSON
The Basic Practice of Statistics
Statistics
ISBN:9781319042578
Author:David S. Moore, William I. Notz, Michael A. Fligner
Publisher:W. H. Freeman
Introduction to the Practice of Statistics
Statistics
ISBN:9781319013387
Author:David S. Moore, George P. McCabe, Bruce A. Craig
Publisher:W. H. Freeman