
MATLAB: An Introduction with Applications
6th Edition
ISBN: 9781119256830
Author: Amos Gilat
Publisher: John Wiley & Sons Inc
expand_more
expand_more
format_list_bulleted
Related questions
Question
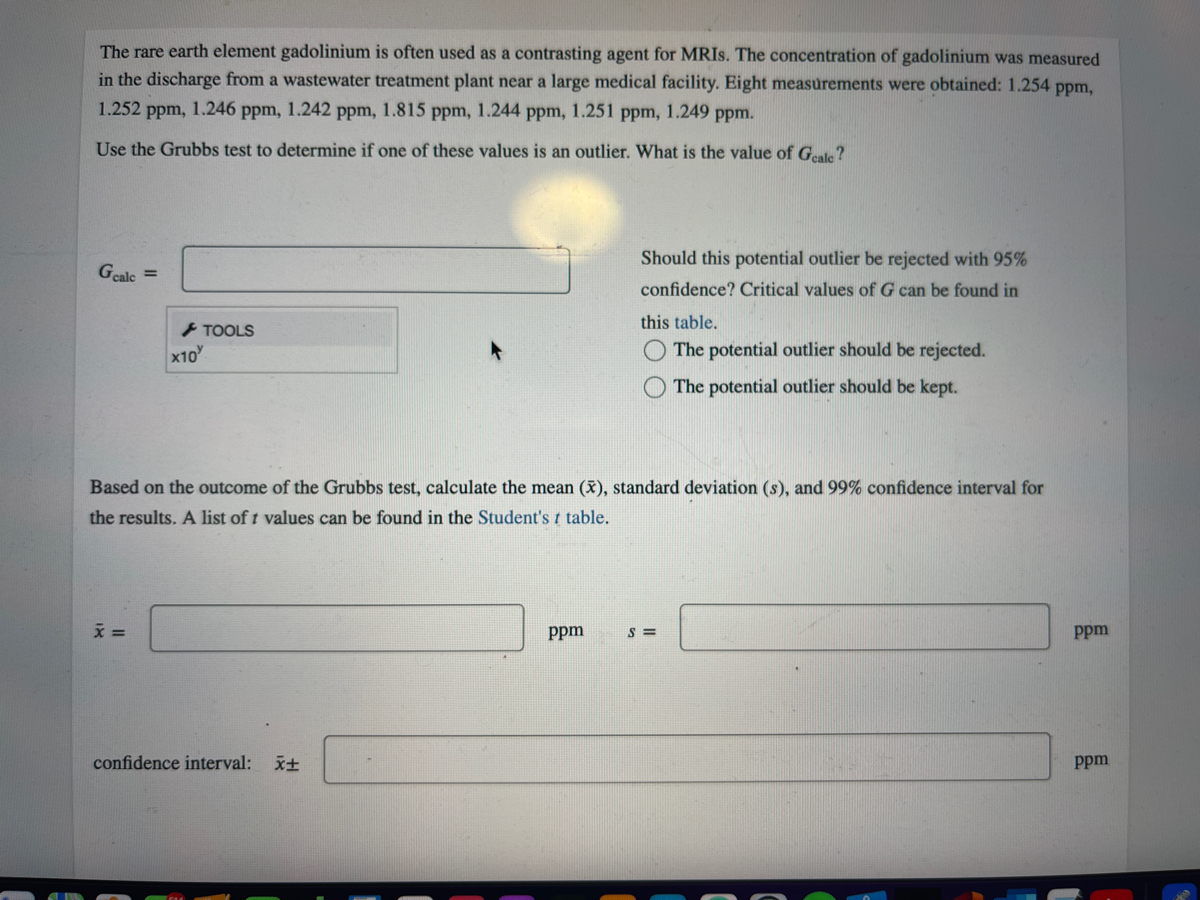

Transcribed Image Text:The rare earth element gadolinium is often used as a contrasting agent for MRIS. The concentration of gadolinium was measured
in the discharge from a wastewater treatment plant near a large medical facility. Eight measurements were obtained: 1.254 ppm,
1.252 ppm, 1.246 ppm, 1.242 ppm, 1.815 ppm, 1.244 ppm, 1.251 ppm, 1.249 ppm.
Use the Grubbs test to determine if one of these values is an outlier. What is the value of Geale?
Should this potential outlier be rejected with 95%
Gcalc =
confidence? Critical values of G can be found in
this table.
+ TOOLS
x10
The potential outlier should be rejected.
The potential outlier should be kept.
Based on the outcome of the Grubbs test, calculate the mean (x), standard deviation (s), and 99% confidence interval for
the results. A list of t values can be found in the Student'st table.
ppm
S =
Ppm
confidence interval:
ppm
Expert Solution
This question has been solved!
Explore an expertly crafted, step-by-step solution for a thorough understanding of key concepts.

This is a popular solution

Trending nowThis is a popular solution!

Step by stepSolved in 3 steps with 3 images

Knowledge Booster

Similar questions
- please provide a clear solution, thank you!arrow_forwardThe following data refers to yield of tomatoes (kg/plot) for four different levels of salinity. Salinity level here refers to electrical conductivity (EC), where the chosen levels were EC = 1.6, 3.8, 6.0, and 10.2 nmhos/cm. (Use i = 1, 2, 3, and 4 respectively.) 1.6: 59.9 53.5 56.7 63.2 58.6 3.8: 55.6 59.6 52.6 54.5 6.0: 51.2 48.6 53.8 48.9 10.2: 44.3 48.4 41.0 47.9 46.5 In USE SALT Use the F test at level a = 0.05 to test for any differences in true average yield due to the different salinity levels. State the appropriate hypotheses. O Ho: H1 = H2 = !3 = H4 H: all four u's are unequal O Ho: H1 = H2 = H3 = H4 H: at least two u's are unequal O Ho: H1 # Hq # Hz# H4 H: all four u's are equal O Ho: H1* H2 * H3# H4 H: at least two u's are equal Calculate the test statistic. (Round your answer to two decimal places.) f = What can be said about the P-value for the test? O P-value > 0.100 O 0.050 < p-value < 0.100 O 0.010 < p-value < 0.050 O 0.001 < P-value < 0.010 O P-value < 0.001arrow_forwardPlease answer... I'm needed only 1 hours time to dd .... Thank uarrow_forward
- 19. In AGHJ, GH=8, HJ= 10, and mZG= 120. To the nearest tenth, what is %3D %3D mZJ?arrow_forwardA. A patient was given a z score of 2.1 for their bone density exam. The μ = 75 and σ = 8. What is their score (X) for the exam? B. A patient was given an exam score of X = 77. The μ = 75 and σ = 8. What is their z score for the exam?arrow_forwardYou investigate the relationship between height and dbh (diameter at breast height) of oak trees. You get the following results: dbh (cm): 26 49 52 32 15 15 39 41 20 30 46 42 21 40 17 38 13 26 49 26height(m): 10.2 13.5 16.3 10.8 8.9 10.0 14.2 11.3 9.7 11.4 13.5 13.6 11.6 11.2 7.7 13.1 7.9 10.4 15.6 9.0 Read the data into R. (a) Calculate the following using R: ̄x , ̄y , SSx, SSy. (Note that to get SSy or SSx, you can just ask R for the variance (var) or standard deviation, and then do the appropriate calculation).(b) Perform a complete test of the hypothesis that there is no difference in height as dbh increases. Write out all the appropriate steps of a regular hypothesis test (give H0, H1, α, your decision, etc.)(c) Give the equation of the least squares linearrow_forward
- What is the water flow from a 1-inch solid stream nozzle on a handline operating at 50 psi? 209.98 gpm 220.38 gpm 218.34 gpm 203.52arrow_forwardA circular shaft is machined on a numerically controlled lathe; the target diameter for the shaft is 37.50 mm, the upper specification limit is 37.55 mm and the lower specification limit is 37.45 mm. Measurements x of shaft diameter are shown in Table 1; these are arranged in 25 sub-groups each containing 5 individuals. For n = 5, A2 = 0.58, D3 = 0.0, D4= 2.11, d2 = 2.326 a) Estimate lower and upper control limits for means and ranges. b) Plot control charts for means and ranges. c) Estimate process capability index Cp.arrow_forwardA lab technician's volume measurements are consistently 8% too high. What is the correct measurement if this technician records a volume of 172 mL?arrow_forward
arrow_back_ios
arrow_forward_ios
Recommended textbooks for you
- MATLAB: An Introduction with ApplicationsStatisticsISBN:9781119256830Author:Amos GilatPublisher:John Wiley & Sons Inc
 Probability and Statistics for Engineering and th...StatisticsISBN:9781305251809Author:Jay L. DevorePublisher:Cengage Learning
 Statistics for The Behavioral Sciences (MindTap C...StatisticsISBN:9781305504912Author:Frederick J Gravetter, Larry B. WallnauPublisher:Cengage Learning
  Elementary Statistics: Picturing the World (7th E...StatisticsISBN:9780134683416Author:Ron Larson, Betsy FarberPublisher:PEARSON
 The Basic Practice of StatisticsStatisticsISBN:9781319042578Author:David S. Moore, William I. Notz, Michael A. FlignerPublisher:W. H. Freeman
 Introduction to the Practice of StatisticsStatisticsISBN:9781319013387Author:David S. Moore, George P. McCabe, Bruce A. CraigPublisher:W. H. Freeman
MATLAB: An Introduction with Applications
Statistics
ISBN:9781119256830
Author:Amos Gilat
Publisher:John Wiley & Sons Inc
Probability and Statistics for Engineering and th...
Statistics
ISBN:9781305251809
Author:Jay L. Devore
Publisher:Cengage Learning
Statistics for The Behavioral Sciences (MindTap C...
Statistics
ISBN:9781305504912
Author:Frederick J Gravetter, Larry B. Wallnau
Publisher:Cengage Learning
Elementary Statistics: Picturing the World (7th E...
Statistics
ISBN:9780134683416
Author:Ron Larson, Betsy Farber
Publisher:PEARSON
The Basic Practice of Statistics
Statistics
ISBN:9781319042578
Author:David S. Moore, William I. Notz, Michael A. Fligner
Publisher:W. H. Freeman
Introduction to the Practice of Statistics
Statistics
ISBN:9781319013387
Author:David S. Moore, George P. McCabe, Bruce A. Craig
Publisher:W. H. Freeman