
MATLAB: An Introduction with Applications
6th Edition
ISBN: 9781119256830
Author: Amos Gilat
Publisher: John Wiley & Sons Inc
expand_more
expand_more
format_list_bulleted
Related questions
Concept explainers
Topic Video
Question
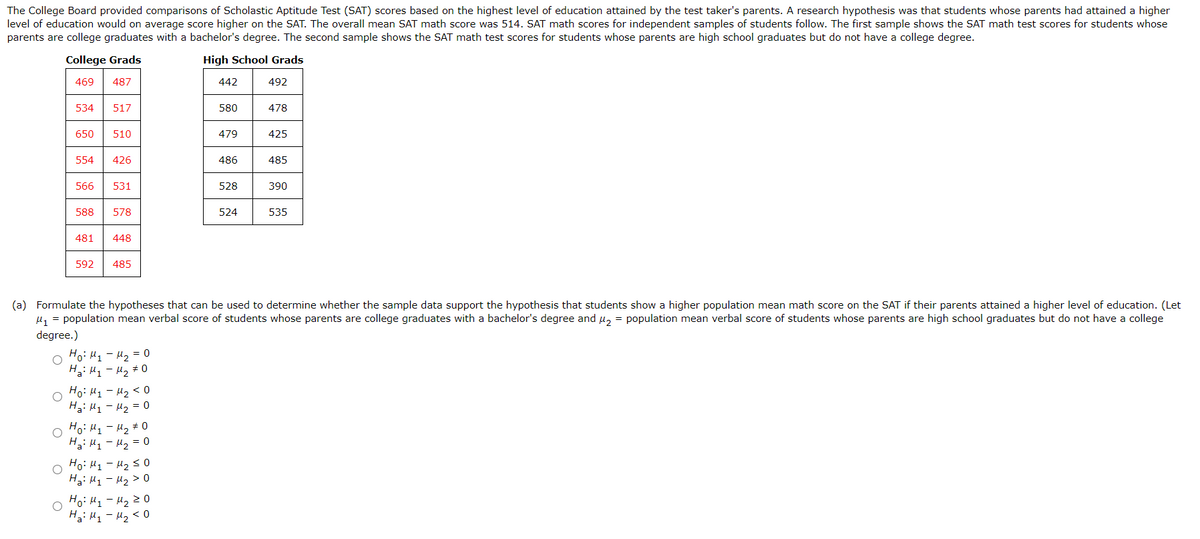

Transcribed Image Text:The College Board provided comparisons of Scholastic Aptitude Test (SAT) scores based on the highest level of education attained by the test taker's parents. A research hypothesis was that students whose parents had attained a higher
level of education would on average score higher on the SAT. The overall mean SAT math score was 514. SAT math scores for independent samples of students follow. The first sample shows the SAT math test scores for students whose
parents are college graduates with a bachelor's degree. The second sample shows the SAT math test scores for students whose parents are high school graduates but do not have a college degree.
College Grads
High School Grads
469
487
442
492
534
517
580
478
650
510
479
425
554
426
486
485
566
531
528
390
588
578
524
535
481
448
592
485
(a) Formulate the hypotheses that can be used to determine whether the sample data support the hypothesis that students show a higher population mean math score on the SAT if their parents attained a higher level of education. (Let
u, = population mean verbal score of students whose parents are college graduates with a bachelor's degree and u, = population mean verbal score of students whose parents are high school graduates but do not have a college
degree.)
O Ho: H1 - H2 = 0
Hai M1 - H2 # 0
0 > Zri – Ti :0H
Hai H1 - H2 = 0
Hoi Hy- Hz#0
Ha: H1 - H2 = 0
Hoi H1 - H2 s0
Ha: M1 - M2 > 0
Ho: Hy - Hz z O
Ha: M1 - H2 < 0

Transcribed Image Text:(b) What is the point estimate of the difference between the means for the two populations?
(c) Find the value of the test statistic. (Round your answer to three decimal places.)
Compute the p-value for the hypothesis test. (Round your answer to four decimal places.)
p-value =
(d) At a = 0.05, what is your conclusion?
O Reject Ho. There is sufficient evidence to conclude that higher population mean verbal scores are associated with students whose parents are college graduates.
O Do not Reject Ho. There is sufficient evidence to conclude that higher population mean verbal scores are associated with students whose parents are college graduates.
O Do not reject Ho. There is insufficient evidence to conclude that higher population mean verbal scores are associated with students whose parents are college graduates.
O Reject Ho. There is insufficient evidence to conclude that higher population mean verbal scores are associated with students whose parents are college graduates.
Expert Solution
This question has been solved!
Explore an expertly crafted, step-by-step solution for a thorough understanding of key concepts.

This is a popular solution

Trending nowThis is a popular solution!

Step by stepSolved in 4 steps with 3 images

Knowledge Booster


Learn more about
Need a deep-dive on the concept behind this application? Look no further. Learn more about this topic, statistics and related others by exploring similar questions and additional content below.Similar questions
- A news article that you read stated that 50% of voters prefer the Democratic candidate. You think that the actual percent is smaller. 128 of the 284 voters that you surveyed said that they prefer the Democratic candidate. What can be concluded at the 0.01 level of significance?arrow_forwardA car wash is assessing the average wait time for its customers. The median wait time is 4 minutes. Does a customer who waits for 5 minutes represent an abnormal wait time? The customer who waits 5 minutes an abnormal case, because 50% of customers wait more than minutes.arrow_forwardCite a statistical experiment and its sample space.arrow_forward
- When reading a problem, one must be aware of the sample size to determine if it is a Z-score or T-score problem. True or falsearrow_forwardA director of research for a radio company conducted a survey of listener preferences and collected information on demographics as well as preferred music. When reviewing the results, he discarded all responses in which a non-Hispanic listener chose Spanish-language music as the favorite genre. Is this an acceptable practice in statistics? Why or why not? Please use terminology associated with statistical practices to explain your answer.arrow_forwardPast studies have indicated that the percentage of smokers was estimated to be about 34%. Given the new smoking cessation programs that have been implemented, you now believe that the percentage of smokers has reduced. You randomly surveyed 1783 people and found that 553 smoke. Use a 0.05 significance level to test the claim that the percentage of smokers has reduced.arrow_forward
- A real-estate appraiser wants to verify the market value for homes on the east side of the city that are very similar to size and style. The appraiser wants to test the popular belief that the average sales price is $37.80 per square foot for such homes. Suppose that a random sample of six sales were selected. The sampled sales prices per square foot are $35.00, $38.10, $37.20, $29.80, $30.30, and $35.40. Assuming a normal distribution is a good model for sales, test the claim that the mean sales price per square foot differs from $37.80 at the 1% significance level.arrow_forwardSierra College students enrolled in an online Elementary Statistics course were asked to participate in an anonymous onlne survey. The survey asked the students "Which type of device will you primarily use to access your online course in Canvas?". Of the 152 students who answered this question, 20 responded "a desktop computer", 121 responded "a laptop computer", 6 responded "a smartphone", and 5 responded "a tablet". The Sierra College Mathematics Department believes that less than 5% of students enrolled in an online Elementary Statistics course primarily uses a smartphone to access their online course in Canvas. Use the data collected in the survey to conduct a hypothesis testing procedure to test this belief. What conclusion should be reached according to the results of this hypothesis test?arrow_forward
arrow_back_ios
arrow_forward_ios
Recommended textbooks for you
- MATLAB: An Introduction with ApplicationsStatisticsISBN:9781119256830Author:Amos GilatPublisher:John Wiley & Sons Inc
 Probability and Statistics for Engineering and th...StatisticsISBN:9781305251809Author:Jay L. DevorePublisher:Cengage Learning
 Statistics for The Behavioral Sciences (MindTap C...StatisticsISBN:9781305504912Author:Frederick J Gravetter, Larry B. WallnauPublisher:Cengage Learning
  Elementary Statistics: Picturing the World (7th E...StatisticsISBN:9780134683416Author:Ron Larson, Betsy FarberPublisher:PEARSON
 The Basic Practice of StatisticsStatisticsISBN:9781319042578Author:David S. Moore, William I. Notz, Michael A. FlignerPublisher:W. H. Freeman
 Introduction to the Practice of StatisticsStatisticsISBN:9781319013387Author:David S. Moore, George P. McCabe, Bruce A. CraigPublisher:W. H. Freeman
MATLAB: An Introduction with Applications
Statistics
ISBN:9781119256830
Author:Amos Gilat
Publisher:John Wiley & Sons Inc
Probability and Statistics for Engineering and th...
Statistics
ISBN:9781305251809
Author:Jay L. Devore
Publisher:Cengage Learning
Statistics for The Behavioral Sciences (MindTap C...
Statistics
ISBN:9781305504912
Author:Frederick J Gravetter, Larry B. Wallnau
Publisher:Cengage Learning
Elementary Statistics: Picturing the World (7th E...
Statistics
ISBN:9780134683416
Author:Ron Larson, Betsy Farber
Publisher:PEARSON
The Basic Practice of Statistics
Statistics
ISBN:9781319042578
Author:David S. Moore, William I. Notz, Michael A. Fligner
Publisher:W. H. Freeman
Introduction to the Practice of Statistics
Statistics
ISBN:9781319013387
Author:David S. Moore, George P. McCabe, Bruce A. Craig
Publisher:W. H. Freeman