A First Course in Probability (10th Edition)
10th Edition
ISBN: 9780134753119
Author: Sheldon Ross
Publisher: PEARSON
expand_more
expand_more
format_list_bulleted
Concept explainers
Topic Video
Question
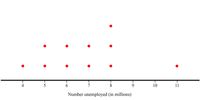
The Bureau of Labor Statistics (BLS) records data on variables related to the U.S. economy, including the number of unemployed people during each year. The following dot plot displays the annual numbers of unemployed people between 1972 and 1982 as reported by the BLS. Each value is reported in units of millions of people.
From the above dot plot, find the

Transcribed Image Text:4
5
6.
7
8.
9.
10
11
Number unemployed (in millions)
Expert Solution
This question has been solved!
Explore an expertly crafted, step-by-step solution for a thorough understanding of key concepts.
This is a popular solution
Trending nowThis is a popular solution!
Step by stepSolved in 2 steps

Knowledge Booster
Learn more about
Need a deep-dive on the concept behind this application? Look no further. Learn more about this topic, probability and related others by exploring similar questions and additional content below.Similar questions
- A theater company asked Its members to bring in canned food for a food drive. Use the categorlcal data to complete the frequency table. Cans Donated to Food Drive Cans Frequency soup com peas peas soup peas com corn corn peas corn peas soup soup soup peas peas peas soup soup soup com cornarrow_forwardA County Board of Supervisors has appointed an urban planning committee to evaluate proposed community development projects. The committee is analyzing, among other things, data on household incomes in two cities within the county. They have collected data on the income of 80 households in each of the two cities. The histograms below show the distributions of the two sets of incomes (in thousands of dollars). Each histogram shows household income on the horizontal axis and number of households on the vertical axis. The means and standard deviations for the data sets are also given. City A City B 25- 25 - 20+ 20- 15- 15- 10+ 10- 5+ 5- 0- 10 20 30 40 50 60 70 80 90 100 10 20 30 40 50 60 70 80 90 100 City A mean: 38.13 thousand dollars City B mean: 55.13 thousand dollars City A standard deviation: 20.84 thousand dollars City B standard deviation: 14.71 thousand dollars The committee wants to use the Empirical Rule to make some approximations about both data sets. Unfortunately, it is…arrow_forwardThe ages (in years)and heights (in inches) of all pitchers for a baseball team are listed. Find the cofficient of a variation for each of the two data sets. Then compare the result.arrow_forward
- dear sir mam how do u create a steam and leaf data plotarrow_forwardThe Big Mac index is a way of measuring Purchasing Power Parity (PPP) between different countries. By diverting the average national Big Mac prices to U.S. dollars, the same goods can be informally compared. The Big Mac can also be a good indicator for the individual purchasing power of an economy since he exists worldwide in standard size, composition and quality. Price # of Countries Rel. f. Cum. f 1.50-1.99 2 2.00-2.49 4 2.50-2.99 7 3.00-3.49 9 3.50-3.99 7 4.00-4.49 8 4.50-4.99 9 5.00-5.49 7 5.50-5.99 1 6.00-6.49 2 6.50-6.99 1arrow_forwardConsider this set of data: 4.5 3.2 3.5 3.9 3.5 3.9 4.3 4.8 3.6 3.3 4.3 4.2 3.9 3.7 4.3 4.4 3.4 4.2 4.4 4.0 3.6 3.5 3.9 4.0 Construct a stem and leaf plot by using the leading digit as the stem. Construct a stem and leaf plot by using each leading digit twice. Does this technique improve the presentation of the data? Explain.arrow_forward
- Which country of origin appears to have the highest “typical” miles per gallon? [ Select ] ["USA", "Sweden", "France", "Japan", "Italy", "Germany"] Which country of origin has the most variation in miles per gallon? [ Select ] ["Sweden", "USA", "France", "Italy", "Japan", "Germany"]arrow_forwardThe following data are the maximum temperatures (in degrees Fahrenheit) of 17 cities in the United states measured on the same day. 53 70 65 74 85 76 84 70 61 59 54 66 56 71 81 73 76 Construct a box and whisker plot for the data.arrow_forwardA County Board of Supervisors has appointed an urban planning committee to evaluate proposed community development projects. The committee is analyzing, among other things, data on household incomes in two cities within the county. They have collected data on the income of 77 households in each of the two cities. The histograms below show the distributions of the two sets of incomes (in thousands of dollars). Each histogram shows household income on the horizontal axis and number of households on the vertical axis. The means and standard deviations for the data sets are also given. City A City B 25+ 20+ 15+ 10+ 5- ← 10 20 30 40 50 60 70 80 90 100 City A mean: 73.96 thousand dollars City A standard deviation: 20.30 thousand dollars Explanation 25- 20- 15- 104 5+ 10 (a) Identify the data set for which it is appropriate to use the Empirical Rule. It is appropriate to use the Empirical Rule for the (Choose one) ▼ data set. 20 30 The committee wants to use the Empirical Rule to make some…arrow_forward
- The following table shows the average annual amount of precipitation (mm) for 16 Canadian cities. Create a box-and-whisker plot to display this information. Precipitation (mm) City St. John's 1482 |Charlottetown 1201 Halifax 1474 Fredericton 1131 Québec City 1208 Montréal 940 |Ottawa 911 |Toronto 819 Winnipeg Regina 504 364 Edmonton 461 |Calgary 399 Vancouver 1167 Victoria 858 Whitehorse 269 Yellowknife 267arrow_forwardWhat is the shape of the distribution for both plots? This graph was from excel.arrow_forwardPlease answer d and earrow_forward
arrow_back_ios
SEE MORE QUESTIONS
arrow_forward_ios
Recommended textbooks for you
 A First Course in Probability (10th Edition)ProbabilityISBN:9780134753119Author:Sheldon RossPublisher:PEARSON

A First Course in Probability (10th Edition)
Probability
ISBN:9780134753119
Author:Sheldon Ross
Publisher:PEARSON
