A First Course in Probability (10th Edition)
10th Edition
ISBN: 9780134753119
Author: Sheldon Ross
Publisher: PEARSON
expand_more
expand_more
format_list_bulleted
Concept explainers
Topic Video
Question

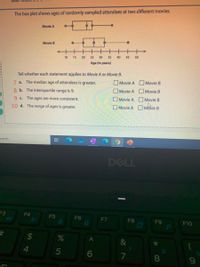
Transcribed Image Text:The box plot shows ages of randomly sampled attendees at two different movies.
Movie A
Movie B
10
15
20
25
30
35
40
45
50
Age (in years)
Tell whether each statement applies to Movie A or Movie B.
7 a. The median age of attendees is greater.
OMovie A Movie B
8 b. The interquartile range is 9.
Movie A OMovie B
9 c. The ages are more consistent.
Movie A Movie B
10 d. The range of ages is greater.
O Movie A Movie B
earch
DELL
53
44
F4
F5
F6
F7
F8
F9
F10
&
7
8
O O O
5
近
%24
4
Expert Solution
This question has been solved!
Explore an expertly crafted, step-by-step solution for a thorough understanding of key concepts.
This is a popular solution
Trending nowThis is a popular solution!
Step by stepSolved in 2 steps

Knowledge Booster
Learn more about
Need a deep-dive on the concept behind this application? Look no further. Learn more about this topic, probability and related others by exploring similar questions and additional content below.Similar questions
- Here is a set of data. 66 105 119 230 240 365 456 507 620 704 742 871 944 964 Identify the 5 number summary (min, Q1, median, Q3, max)arrow_forwarde SC A police officer recorded the following speeds of cars at a certain point on the highway: 55, 55, 49, 62, 68, 56, 55, 84, 52, 73, 58, 58 What was the median speed of the drivers? L A Moving to another question will save this response. MacBook Proarrow_forwardState whether the data described below are discrete or continuous, and explain why. The numbers of fingers that different people have Choose the correct answer below. O A. The data are continuous because the data can only take on specific values. O B. The data are continuous because the data can take on any value in an interval. O C. The data are discrete because the data can take on any value in an interval. O D. The data are discrete because the data can only take on specific values.arrow_forward
- Two-Way Frequency Tables Practice 1. The students in a seaside school will have to take extra swimming lessons if they cannot swim. The table below gives information about the students in grades 7, 8 and 9. Can swim Cannot Total swim Grade 7 120 60 180 179 Grade 8 168 11 Grade 9 172 3. 175 74 534 Total a. Complete the table. 74 b. How many students need swimming lessons?. 179 c. How many students are there in 8th grade? d. How many of the 7th grade students cannot swim? (00 e. How many students in grades 7 and 8 can swim? 288 f. How many students are there altogether in grades 7, 8, and 9? 534 g. What is the probability that a student is a 7th grader? 32 h. What is the probability that a student is an 8th grader and can swim to all 8th graders? A 33 i. What is the probability that a student cannot swim? 14arrow_forwardA. The following are the scores of Grade 10 SPA in their Mau 8, 7, 8, 5, 6, 7, 9, 5, 7, 9, 6, 8, 4, 6, 9, 7, 8, 5, 7, 8, 10 1. Find Q₁. 2. Find Dz. 3. Find P⁹o. B. Refer to the table at the right. 1. Fill in the column for cumulative frequency. 2. What is N? 3. Compute for the following measures of position and interpret the result. a. Q₂ b. De C. P75 NUMBER OF COVID-19 PATIENTS IN THE PHILIPPINES PER AGE GROUP Cumulative Age Frequency Frequency 0-9 3 10-19 7 20-29 2 30-39 3 40-49 5 50-59 7 60-69 6 70-79 80-89 90-99 . 6 4 7 N=arrow_forwardFind a set of 5 items in a data set that have a range of 9, a mean of 11, a median of 12, and a mode of 15arrow_forward
- Here is a set of data. 6 7 260 301 338 417 504 623 649 714 867 907 Identify the 5 number summary (min, Q1, median, Q3, max) , , , ,arrow_forwardDetermine whether the statement is true or false. If it is false, rewrite it as a true statement. Some quantitative data sets do not have medians. Choose the correct answer below. O A. The statement is true. O B. The statement is false. Some quantitative data sets do not have means. O C. The statement is false. All quantitative data set have medians. O D. The statement is false. Some quantitative data sets have more than one median.arrow_forwardState, whether the quantity described, is a parameter or a statistic and give the correct notation. The proportion of all college students in the US, using data from the US Census. A. It is neither a parameter nor a statistic. The notation is alfa. B. It is a sample statistic. The notation is x-bar. C. It is a population parameter. The notation is p.arrow_forward
- The table below shows the number of books the Jefferson Middle school students readeach month for nine months. If the students read only 101 books for the month of June, which measure of central tendency will have the greatest change?A. All measures will have an equal change.B. The median will have the greatest change.C. The mean will have the greatest change.D. The mode will have the greatest change.arrow_forwardWould love three help. Q9arrow_forwardPlease do not give solution in image format thankuarrow_forward
arrow_back_ios
SEE MORE QUESTIONS
arrow_forward_ios
Recommended textbooks for you
 A First Course in Probability (10th Edition)ProbabilityISBN:9780134753119Author:Sheldon RossPublisher:PEARSON

A First Course in Probability (10th Edition)
Probability
ISBN:9780134753119
Author:Sheldon Ross
Publisher:PEARSON
