
FINANCIAL ACCOUNTING
10th Edition
ISBN: 9781259964947
Author: Libby
Publisher: MCG
expand_more
expand_more
format_list_bulleted
Related questions
Question
The beginning inventory at ABC Supplies and data on purchases and sales for a three-month period ending March 31, are as follows: (See attached dates/transactions/units/totals list attached)
1. Record the inventory, purchases, and cost of merchandise sold data in a perpetual inventory record, using the first-in, first-out method. (I have attached an example of how the table should look as I had a hard time formatting the blank table I provided below)
| Date | Purchases | Cost of Merchandise sold | Inventory | ||||||
| Quantity | Unit Cost | Total Cost | Quantity | Unit Cost | Total Cost | Quantity | Unit Cost | Total Cost | |
| Jan. 1 |
|
|
|
||||||
| 10 |
|
|
|
|
|
|
|||
| 10 |
|
|
|
||||||
| 28 |
|
|
|
||||||
| 28 |
|
|
|
|
|
|
|||
| 30 |
|
|
|
|
|
|
|||
| Feb. 5 |
|
|
|
|
|
|
|||
| 10 |
|
|
|
|
|
|
|||
| 10 |
|
|
|
||||||
| 16 |
|
|
|
||||||
| 16 |
|
|
|
|
|
|
|||
| 28 |
|
|
|
|
|
|
|||
| Mar. 5 |
|
|
|
|
|
|
|||
| 5 |
|
|
|
||||||
| 14 |
|
|
|
||||||
| 14 |
|
|
|
|
|
|
|||
| 25 |
|
|
|
|
|
|
|||
| 25 |
|
|
|
||||||
| 30 |
|
|
|
|
|
|
|||
| 30 |
|
|
|
||||||
| 31 | Balances |
|
|
2. |
Determine the total sales and the total cost of merchandise sold for the period. Journalize the entries in the sales and cost of merchandise sold accounts. Assume that all sales were on the account and date your |
| 3. | Determine the gross profit from sales for the period. |
| 4. | Determine the ending inventory cost as of March 31. |
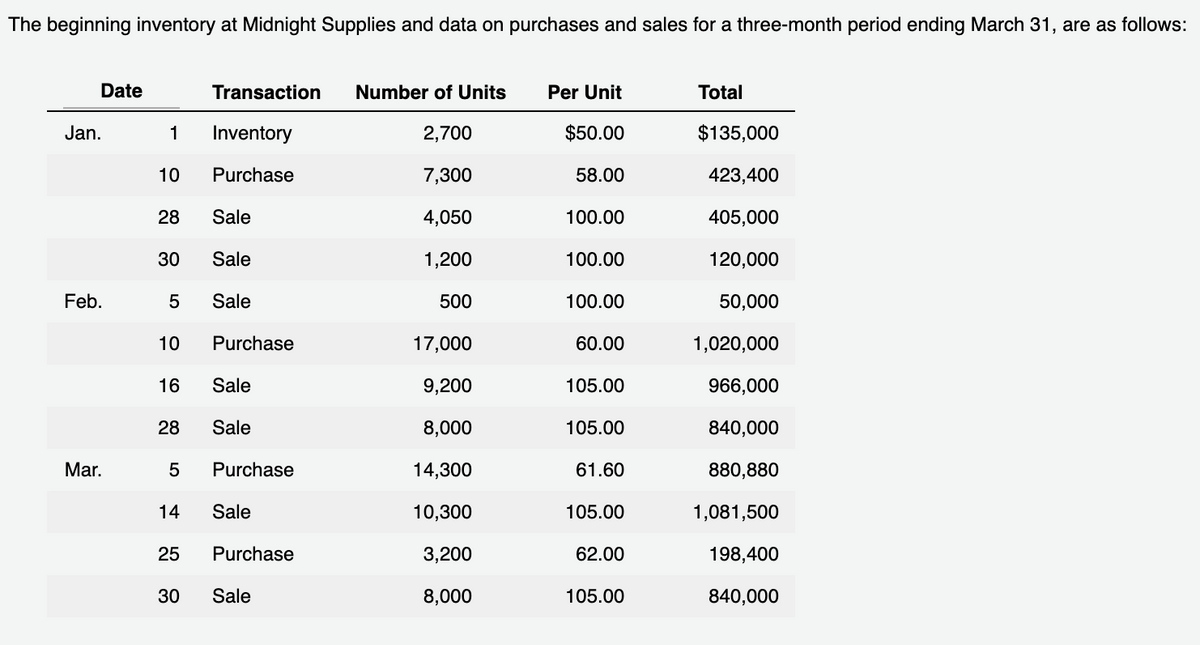

Transcribed Image Text:The beginning inventory at Midnight Supplies and data on purchases and sales for a three-month period ending March 31, are as follows:
Date
Transaction
Number of Units
Per Unit
Total
Jan.
1
Inventory
2,700
$50.00
$135,000
10
Purchase
7,300
58.00
423,400
28
Sale
4,050
100.00
405,000
30
Sale
1,200
100.00
120,000
Feb.
Sale
500
100.00
50,000
10
Purchase
17,000
60.00
1,020,000
16
Sale
9,200
105.00
966,000
28
Sale
8,000
105.00
840,000
Mar.
5
Purchase
14,300
61.60
880,880
14
Sale
10,300
105.00
1,081,500
25
Purchase
3,200
62.00
198,400
30
Sale
8,000
105.00
840,000

Transcribed Image Text:Purchases
Sold
Balance
Unit
Qty
price
Unit
Qty
price
Date
Unit
Qty
price
Total
Total
Total
03-Apr
08-Аpr| 96
48 | 450
48 450
96| 540
21,600
21,600
51,840
540
51,840
11-Apr
48 | 450
16| 540
40 | 540
21,600 80 540
8,640
21,600 40 540
40 | 540
80 600
21,600 72 600
4,800
43,200
30-Аpr
08-May 80
21,600
21,600
48,000
600
48,000
10-May
40 | 540
43,200
8
600
19-May
28-May 80
24| 600
14,400 48 600
48 | 600
28,800
660
52,800
28,800
80
660
52,800
48 600
64| 660
28,800 80 660
42,240 16
05-Jun
52,800
16-Jun
660
10,560
21-Jun 144 720 | 1,03,680
16
660
10,560
144 720 1,03,680
16| 660
56 720
28-Jun
10,560 88 720
63,360
40,320
Total
2,14,560
63,360
Expert Solution
arrow_forward
Step 1
First-in, first-out method is the method that is used to record the purchase sales and inventory of goods into business in which is assumed that the first purchased inventory is sold first. This means at the time of sales, the oldest inventory purchased is sold first.

Step by stepSolved in 5 steps with 4 images

Knowledge Booster


Learn more about
Need a deep-dive on the concept behind this application? Look no further. Learn more about this topic, accounting and related others by exploring similar questions and additional content below.Similar questions
- need help with all working , explanation , computation , formula, with stepsarrow_forwardThe following data regarding purchases and sales of a commodity were taken from the related inventory account (perpetual inventory system is used): May 1 Balance 25 units at $41 6 Sale 20 units 8 Purchase 20 units at $42 16 Sale 10 units 20 Purchase 20 units at $43 23 Sale 25 units 30 Purchase 15 units at $45 (a) Determine the total cost of the inventory balance at May 31, using the first-in, first-out method. Also, identify the quantity, unit price, and total cost of each lot/layer in the ending inventory. (b) Determine the total cost of the inventory balance at May 31, using the last-in, first-out method. Also, identify the quantity, unit price, and total cost of each lot/layer in the ending inventory. (a) FIFO (b) LIFOarrow_forwardB66's transactions involving inventory for the month are shown below. Calculate the dollar amount of Sales, Cost of Goods Sold, Gross Margin and Ending Inventory using the three cost allocation methods (FIFO, LIFO, and Weighted Average) with perpetual inventory updating. Number of Units Unit Cost Sales Beginning Inventory 100 $66 Sold 50 $120 Purchased 80 $75 Sold 25 $125 Ending Inventory 105 Show your calculations and clearly label your solution. Submit your work as an attachment to this assignment.arrow_forward
- sarrow_forwardRapid Resources, which uses the FIFO inventory costing method, has the following account balances at July 31, 2025, prior to releasing the financial statements for the year: Merchandise Inventory, ending $ Cost of Goods Sold Net Sales Revenue Date 16,500 71,000 122,000 Jul. 31 Requirement 1. Prepare any adjusting journal entry required from the given information. (Record debits first, then credits. Select the explanation on the last line of the journal entry. For situations that do not require an entry, make sure to select "No entry required" in the first cell in the "Accounts" column and leave all other cells blank.) Accounts and Explanation Credit Rapid has determined that the current replacement cost (current market value) of the July 31, 2025, ending merchandise inventory is $13,500. Read the requirements. Debit 4arrow_forwardI need help.arrow_forward
- PLEASE HELP MEarrow_forward[The following information applies to the questions displayed below.] Laker Company reported the following January purchases and sales data for its only product. For specific identification, ending inventory consists of 270 units from the January 30 purchase, 5 units from the January 20 purchase, and 10 units from beginning inventory. Date January 1 January 10 January 20 January 25 January 30 Assume the perpetual inventory system is used. Required: Activities Beginning inventory Sales Purchase Sales Purchase Totals Req 1 Req 2 to 4 Sales Cost of goods sold Gross profit Complete this question by entering your answers in the tabs below. Specific Identification $ LAKER COMPANY For Month Ended January 31 Weighted Average $ Units Acquired at Cost 185 units @ $11.00 = 5,600 100 units @ 1. Compute gross profit for the month of January for Laker Company for the four inventory methods. 2. Which method yields the highest gross profit? 3. Does gross profit using weighted average fall between that…arrow_forwardRequired information [The following information applies to the questions displayed below.] Total Date March 1 March 5 March 9 March 18 March 25 March 29 Warnerwoods Company uses a perpetual inventory system. It entered into the following purchases and sales transactions for March. Beginning inventory Purchases: March 5 March 18 March 25 Activities Beginning inventory Purchase Sales Purchase Purchase Sales Totals Saved Required: 1. Compute cost of goods available for sale and the number of units available for sale. # of units Cost per Unit Units Acquired at Cost 100 units @ $51.00 per unit 225 units @ $56.00 per unit 130 units @ $96.00 per unit 390 units Subnarrow_forward
arrow_back_ios
SEE MORE QUESTIONS
arrow_forward_ios
Recommended textbooks for you
 AccountingAccountingISBN:9781337272094Author:WARREN, Carl S., Reeve, James M., Duchac, Jonathan E.Publisher:Cengage Learning,
 Accounting Information SystemsAccountingISBN:9781337619202Author:Hall, James A.Publisher:Cengage Learning,
 Horngren's Cost Accounting: A Managerial Emphasis...AccountingISBN:9780134475585Author:Srikant M. Datar, Madhav V. RajanPublisher:PEARSON
 Intermediate AccountingAccountingISBN:9781259722660Author:J. David Spiceland, Mark W. Nelson, Wayne M ThomasPublisher:McGraw-Hill Education
 Financial and Managerial AccountingAccountingISBN:9781259726705Author:John J Wild, Ken W. Shaw, Barbara Chiappetta Fundamental Accounting PrinciplesPublisher:McGraw-Hill Education
Accounting
Accounting
ISBN:9781337272094
Author:WARREN, Carl S., Reeve, James M., Duchac, Jonathan E.
Publisher:Cengage Learning,
Accounting Information Systems
Accounting
ISBN:9781337619202
Author:Hall, James A.
Publisher:Cengage Learning,
Horngren's Cost Accounting: A Managerial Emphasis...
Accounting
ISBN:9780134475585
Author:Srikant M. Datar, Madhav V. Rajan
Publisher:PEARSON
Intermediate Accounting
Accounting
ISBN:9781259722660
Author:J. David Spiceland, Mark W. Nelson, Wayne M Thomas
Publisher:McGraw-Hill Education
Financial and Managerial Accounting
Accounting
ISBN:9781259726705
Author:John J Wild, Ken W. Shaw, Barbara Chiappetta Fundamental Accounting Principles
Publisher:McGraw-Hill Education