
MATLAB: An Introduction with Applications
6th Edition
ISBN: 9781119256830
Author: Amos Gilat
Publisher: John Wiley & Sons Inc
expand_more
expand_more
format_list_bulleted
Related questions
Concept explainers
Question
The annual earnings of 12 randomly selected computer software engineers have a sample standard deviation of $3707.
Assume the sample is from a
Use a 99% level of confidence. Interpret the results.
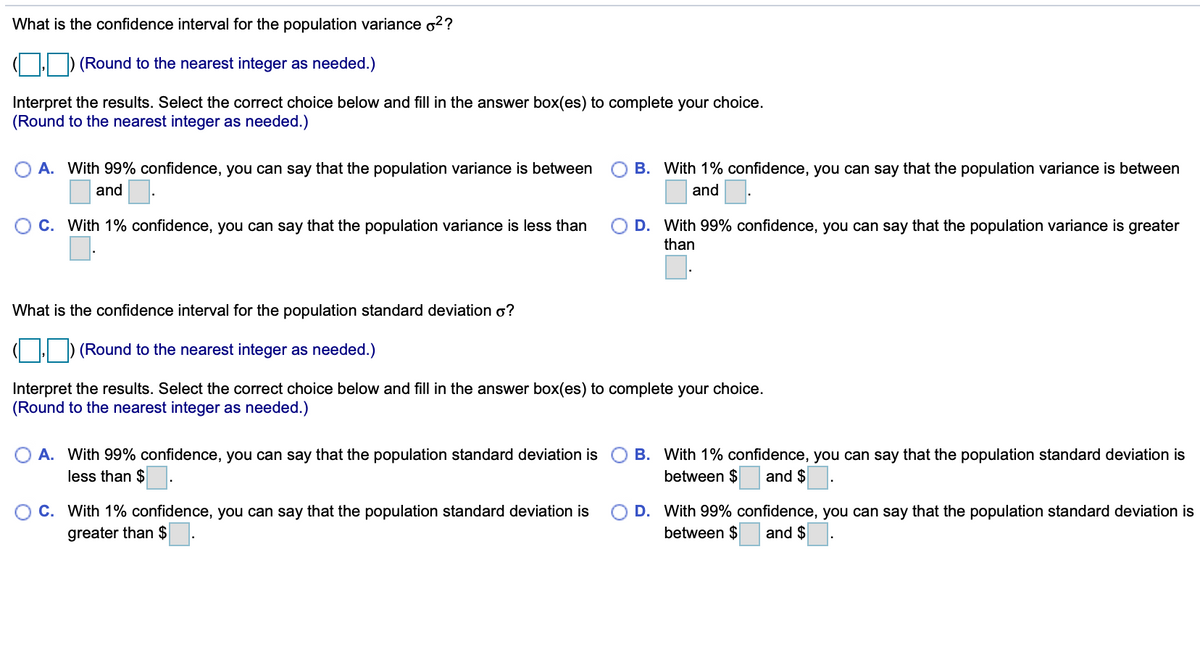

Transcribed Image Text:What is the confidence interval for the population variance o2?
| ) (Round to the nearest integer as needed.)
Interpret the results. Select the correct choice below and fill in the answer box(es) to complete your choice.
(Round to the nearest integer as needed.)
A. With 99% confidence, you can say that the population variance is between O B. With 1% confidence, you can say that the population variance is between
and
and
C. With 1% confidence, you can say that the population variance is less than
O D. With 99% confidence, you can say that the population variance is greater
than
What is the confidence interval for the population standard deviation o?
) (Round to the nearest integer as needed.)
Interpret the results. Select the correct choice below and fill in the answer box(es) to complete your choice.
(Round to the nearest integer as needed.)
A. With 99% confidence, you can say that the population standard deviation is
less than $
B. With 1% confidence, you can say that the population standard deviation is
between $
and $
C. With 1% confidence, you can say that the population standard deviation is
greater than $
O D. With 99% confidence, you can say that the population standard deviation is
between $
and $
Expert Solution
This question has been solved!
Explore an expertly crafted, step-by-step solution for a thorough understanding of key concepts.

This is a popular solution

Trending nowThis is a popular solution!

Step by stepSolved in 3 steps with 3 images

Knowledge Booster


Learn more about
Need a deep-dive on the concept behind this application? Look no further. Learn more about this topic, statistics and related others by exploring similar questions and additional content below.Similar questions
- In a random sample of twelve people, the mean driving distance to work was 18.8 miles and the standard deviation was 4.9 miles. Assume the population is normally distributed and use the t-distribution to find the margin of error and construct a 90% confidence interval for the population mean μ. Interpret the results.arrow_forwardYou are given the sample mean and the population standard deviation. Use this information to construct the 90% and 95% confidence intervals for the population mean. Interpret the results and compare the widths of the confidence intervals. If convenient, use technology to construct the confidence intervals. A random sample of 55 home theater systems has a mean price of $120.00. Assume the population standard deviation is $18.20.arrow_forwardAssume that adults have IQ scores that are normally distributed with a mean of 102.1 and a standard deviation 16.3. Find the first quartile Q1, which is the IQ score separating the bottom 25% from the top 75%. (Hint: Draw a graph.)arrow_forward
- In a random sample of 60 refrigerators, the mean repair cost was $111.00 and the population standard deviation is $16.40. Construct a 95% confidence interval for the population mean repair cost. Interpret the results. Construct a 95% confidence interval for the population mean repair cost. The 95% confidence interval is ( D. (Round to two decimal places as needed.)arrow_forwardAfter the pandemic hit and people were forced to spend more time indoors, there have been a suspicion among health professionals. that people are eating more and thus gaining weight. In 2018, the average weight of 192 pounds, and health experts want to know if that average weight of the American male has gone up during this pandemic. d. A sample of 50 American males yeilded a sample average weight of 195 pounds and a sample standard deviation of 14.5 pounds. What is your conclusion at the 5% level of significance? (be sure to state your conclusion in the context of this problem) e. Would your conclusion change if the level of significance were changed to 1%? Briefly explain.arrow_forwardIn a random sample of eleven people, the mean driving distance to work was 18.1 miles and the standard deviation was 7.6 miles. Assume the population is normally distributed and use the t-distribution to find the margin of error and construct a 99% confidence interval for the population mean μ. Interpret the results.arrow_forward
- Health insurers and the federal government are both putting pressure on hospitals to shorten the average length of stay (LOS) of their patients. The average LOS in the United States is 4.6 days (Healthcare Cost and Utilization Project Statistical Brief, December 2018). A random sample of 22 hospitals in one state had a mean LOS of 3.6 days and a standard deviation of 2.1 days. Assume that the sampled population is approximately normal. Complete parts a through c. Question content area bottom Part 1 a. Use a 99% confidence interval to estimate the population mean LOS for the state's hospitals. enter your response here, enter your response here (Round to three decimal places as needed.)arrow_forwardYou are given the sample mean and the population standard deviation. Use this information to construct the 90% and 95% confidence intervals for the population mean. Interpret the results and compare the widths of the confidence intervals.From a random sample of 66 dates, the mean record high daily temperature in a certain city has a mean of 85.22 F. Assume the population standard deviation is 15.45 F.arrow_forwardAssume that adults have IQ scores that are normally distributed with a mean of 97.8 and a standard deviation 22.5. Find the first quartile Q1, which is the IQ score separating the bottom 25% from the top 75%. (Hint: Draw a graph.)arrow_forward
arrow_back_ios
arrow_forward_ios
Recommended textbooks for you
- MATLAB: An Introduction with ApplicationsStatisticsISBN:9781119256830Author:Amos GilatPublisher:John Wiley & Sons Inc
 Probability and Statistics for Engineering and th...StatisticsISBN:9781305251809Author:Jay L. DevorePublisher:Cengage Learning
 Statistics for The Behavioral Sciences (MindTap C...StatisticsISBN:9781305504912Author:Frederick J Gravetter, Larry B. WallnauPublisher:Cengage Learning
  Elementary Statistics: Picturing the World (7th E...StatisticsISBN:9780134683416Author:Ron Larson, Betsy FarberPublisher:PEARSON
 The Basic Practice of StatisticsStatisticsISBN:9781319042578Author:David S. Moore, William I. Notz, Michael A. FlignerPublisher:W. H. Freeman
 Introduction to the Practice of StatisticsStatisticsISBN:9781319013387Author:David S. Moore, George P. McCabe, Bruce A. CraigPublisher:W. H. Freeman
MATLAB: An Introduction with Applications
Statistics
ISBN:9781119256830
Author:Amos Gilat
Publisher:John Wiley & Sons Inc
Probability and Statistics for Engineering and th...
Statistics
ISBN:9781305251809
Author:Jay L. Devore
Publisher:Cengage Learning
Statistics for The Behavioral Sciences (MindTap C...
Statistics
ISBN:9781305504912
Author:Frederick J Gravetter, Larry B. Wallnau
Publisher:Cengage Learning
Elementary Statistics: Picturing the World (7th E...
Statistics
ISBN:9780134683416
Author:Ron Larson, Betsy Farber
Publisher:PEARSON
The Basic Practice of Statistics
Statistics
ISBN:9781319042578
Author:David S. Moore, William I. Notz, Michael A. Fligner
Publisher:W. H. Freeman
Introduction to the Practice of Statistics
Statistics
ISBN:9781319013387
Author:David S. Moore, George P. McCabe, Bruce A. Craig
Publisher:W. H. Freeman