
Related questions

Confidence Interval: In statistics, we can say a range of values of the specified population parameter that is lies within it with some confidence is known as Confidence Interval. They can take any number of probability limits, with the most common being a 90%, 95% or 99% confidence level. Confidence level is denoted by 1 - . The probability that the confidence interval actually contains the population parameter.
The most commonly used confidence levels are 90%, 95% and 99%.
If you have set of data is under 30 (n < 30), you want to use t-distribution instead of the normal distribution(z-score) to construct your confidence interval and Vice-versa.
Then the formula for constructing the confidence interval at 90% confidence level is given by
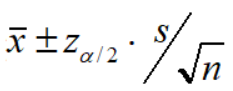
where x-bar is sample mean
s is sample standard deviation
n is sample size and
z/2 is the Critical value.

Step by stepSolved in 2 steps with 1 images


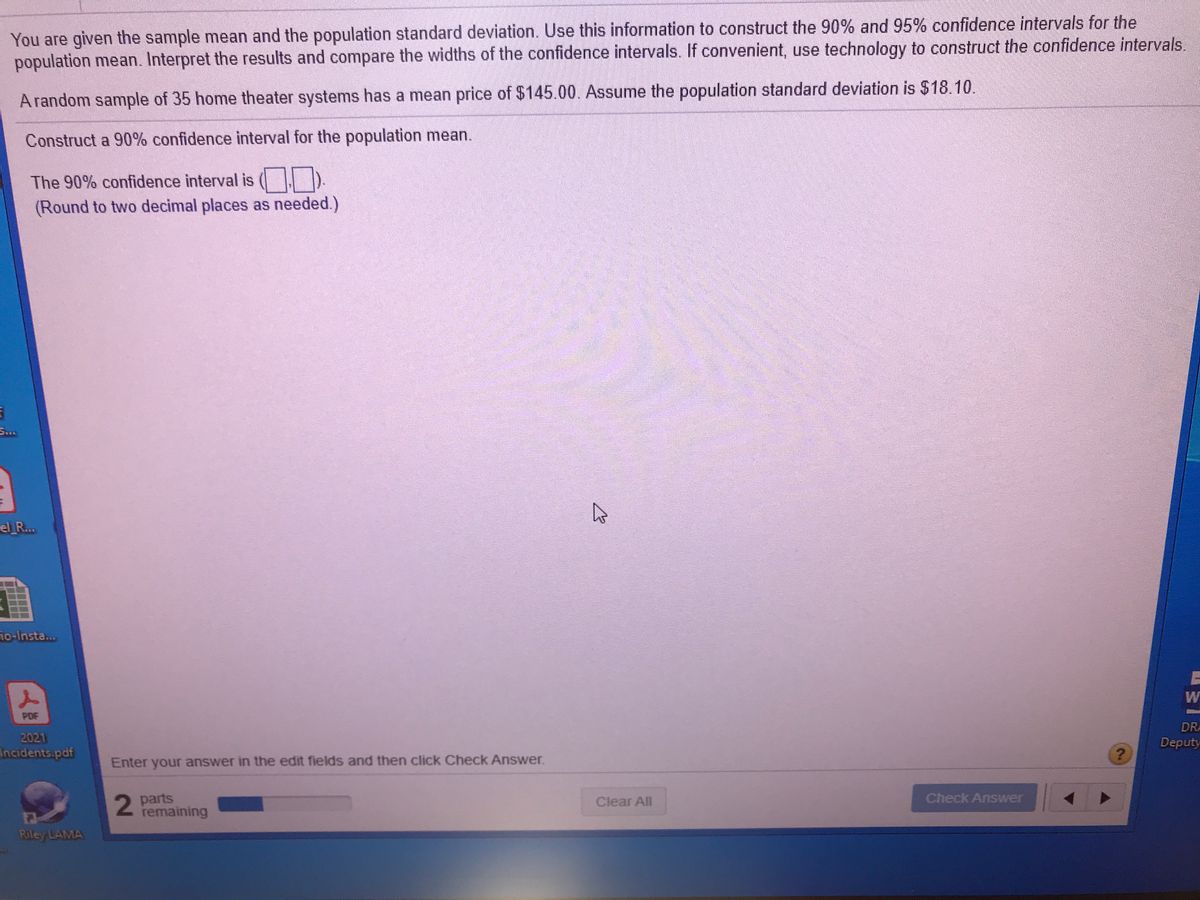
- Please help with B and Carrow_forwardYou are given the sample mean and the population standard deviation. Use this information to construct the 90% and 95% confidence intervals for the population mean. Interpret the results and compare the widths of the confidence intervals. If convenient, use technology to construct the confidence intervals. A random sample of 40 home theater systems has a mean price of $145.00. Assume the population standard deviation is $15.50. Construct a 90% confidence interval for the population mean. The 90% confidence interval is ( I D. (Round to two decimal places as needed.) 11 Construct a 95% confidence interval for the population mean. 11 11 The 95% confidence interval i ( ). (Round to two decimal places as needed.) 11 11arrow_forwardYou are given the sample mean and the population standard deviation. Use this information to construct the 90% and 95% confidence intervals for the population mean. Interpret the results and compare the widths of the confidence intervals. If convenient, use technology to construct the confidence intervals. A random sample of 35 home theater systems has a mean price of $145.00. Assume the population standard deviation is $18.10. Construct a 90% confidence interval for the population mean. The 90% confidence interval is (139.97, 150.03). (Round to two decimal places as needed.) Construct a 95% confidence interval for the population mean. The 95% confidence interval is ( 139 , 151). (Round to two decimal places as needed.) Interpret the results. Choose the correct answer below O A. With 90% confidence, it can be said that the sample mean price lies in the first interval. With 95% confidence, it can be said that the sample mean price lies in the second interval. The 95% confidence interval…arrow_forward
- You are given the sample mean and the population standard deviation. Use this information to construct the 90% and 95% confidence intervals for the population mean. Interpret the results and compare the widths of the confidence intervals. From a random sample of 74 dates, the mean record high daily temperatur in a certain city has a mean of 85.27°F. Assume the population standard deviation is 14.71°F. Which interval is wider? Choose the correct answer below. The 95% confidence interval O The 90% confidence interval Interpret the results. A. You can be 90% confident that the population mean record high temperature is between the bounds of the 90% confidence interval, and 95% confident for the 95% interval. B. You can be certain that the mean record high temperature was within the 90% confidence interval for approximately 67 of the 74 days, and was within the 95% confidence interval for approximately 70 of the 74 days. C. You can be certain that the population mean record high…arrow_forwardYou are given the sample mean and the population standard deviation. Use this information to construct the 90% and 95% confidence intervals for the population mean. Interpret the results and compare the widths of the confidence intervals. If convenient, use technology to construct the confidence intervals. A random sample of 45 home theater systems has a mean price of $137.00. Assume the population standard deviation is $18.50. The 90% confidence interval is ( 132.37, 141.63 (Round to two decimal places as needed.) Construct a 95% confidence interval for the population mean. The 95% confidence interval is ( 131.44 142.56) (Round to two decimal places as needed.) Interpret the results. Choose the correct answer below. O A. With 90% confidence, it can be said that the population mean price lies in the first interval. With 95% confidence, it can be said that the population mean price lies in the second interval. The 95% confidence interval is wider than the 90%. O B. With 90% confidence,…arrow_forwardYou are given the sample mean and the population standard deviation. Use this information to construct the 90% and 95% confidence intervals for the population mean. Interpret the results and compare the widths of the confidence intervals. If convenient, use technology to construct the confidence intervals. A random sample of 40 home theater systems has a mean price of $149.00. Assume the population standard deviation is $19.30. Construct a 90% confidence interval for the population mean. The 90% confidence interval is (Round to two decimal places as needed.) Construct a 95% confidence interval for the population mean. The 95% confidence interval is (,). (Round to two decimal places as needed.) Interpret the results. Choose the correct answer below. A. With 90% confidence, it can be said that the population mean price lies in the first interval. With 95% confidence, it can be said that the population mean price lies in the second interval. The 95% confidence interval is wider than the…arrow_forward
- You are given the sample mean and the population standard deviation. Use this information to construct the 90% and 95% confidence intervals for the population mean. Interpret the results and compare the widths of the confidence intervals. If convenient, use technology to construct the confidence intervals. A random sample of 35 home theater systems has a mean price of$134.00. Assume the population standard deviation is $18.70. Construct a 90% confidence interval for the population mean. The 90% confidence interval is _____ (Round to two decimal places as needed) Construct a 95% confidence interval for the population mean. The 95% confidence interval is _____ (Round to two decimal places as needed)arrow_forwardYou are given the sample mean and the population standard deviation. Use this information to construct the 90% and 95% confidence intervals for the population mean. Interpret the results and compare the widths of the confidence intervals. If convenient, use technology to construct the confidence intervals. A random sample of 45 home theater systems has a mean price of $113.00. Assume the population standard deviation is $19.80. Construct a 90% confidence interval for the population mean.arrow_forwardYou are given the sample mean and the population standard deviation. Use this information to construct the 90% and 95% confidence intervals for the population mean. Interpret the results and compare the widths of the confidence intervals. From a random sample of 48 business days, the mean closing price of a certain stock was $118.91. Assume the population standard deviation is $10.35. The 90% confidence interval is ( (Round to two decimal places as needed.) The 95% confidence interval is (Round to two decimal places as needed.) Which interval is wider? Choose the correct answer below. O The 90% confidence interval O The 95% confidence interval Interpret the results. OA. You can be 90% confident that the population mean price of the stock is outside the bounds of the 90% confidence interval, and 95% confident for the 95% interval. OB. You can be certain that the population mean price of the stock is either between the lower bounds of the 90% and 95% confidence intervals or the upper…arrow_forward
- You are given the sample mean and the population standard deviation. Use this information to construct the 90% and 95% confidence intervals for the population mean. Interpret the results and compare the widths of the confidence intervals. From a random sample of 39 business days, the mean closing price of a certain stock was $106.99.Assume the population standard deviation is $10.66.arrow_forwardYou are given the sample mean and the population standard deviation. Use this information to construct the 90% and 95% confidence intervals for the population mean. Interpret the results and compare the widths of the confidence intervals.From a random sample of 48 business days, the mean closing price of a certain stock was $120.45. Assume the population standard deviation is $10.76.arrow_forwardYou are given the sample mean and the population standard deviation. Use this information to construct the 90% and 95% confidence intervals for the population mean. Interpret the results and compare the widths of the confidence intervals. If convenient, use technology to construct the confidence intervals. A random sample of 35 home theater systems has a mean price of $145.00. Assume the population standard deviation is $18 10. Construct a 90% confidence interval for the population mean. The 90% confidence interval is (139 97 , 150.03). (Round to two decimal places as needed.) Construct a 95% confidence interval for the population mean. The 95% confidence interval is ( D (Round to two decimal places as needed.) A R.. -Insta... of W PDF DRAFT 2021 Deputy Fire... zidents.pdf Enter your answer in the edit fields and then click Check Answer. Check Answer 1 part remaining Clear All Riley LAMA DRAFT Deputy Fire... 0 Calendar - mregal... Answered: You are...arrow_forward
- MATLAB: An Introduction with ApplicationsStatisticsISBN:9781119256830Author:Amos GilatPublisher:John Wiley & Sons Inc
 Probability and Statistics for Engineering and th...StatisticsISBN:9781305251809Author:Jay L. DevorePublisher:Cengage Learning
 Statistics for The Behavioral Sciences (MindTap C...StatisticsISBN:9781305504912Author:Frederick J Gravetter, Larry B. WallnauPublisher:Cengage Learning
  Elementary Statistics: Picturing the World (7th E...StatisticsISBN:9780134683416Author:Ron Larson, Betsy FarberPublisher:PEARSON
 The Basic Practice of StatisticsStatisticsISBN:9781319042578Author:David S. Moore, William I. Notz, Michael A. FlignerPublisher:W. H. Freeman
 Introduction to the Practice of StatisticsStatisticsISBN:9781319013387Author:David S. Moore, George P. McCabe, Bruce A. CraigPublisher:W. H. Freeman