MATLAB: An Introduction with Applications
6th Edition
ISBN: 9781119256830
Author: Amos Gilat
Publisher: John Wiley & Sons Inc
expand_more
expand_more
format_list_bulleted
Question

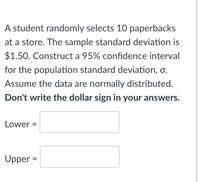
Transcribed Image Text:A student randomly selects 10 paperbacks
at a store. The sample standard deviation is
$1.50. Construct a 95% confidence interval
for the population standard deviation, o.
Assume the data are normally distributed.
Don't write the dollar sign in your answers.
Lower =
Upper =
Expert Solution
This question has been solved!
Explore an expertly crafted, step-by-step solution for a thorough understanding of key concepts.
This is a popular solution
Trending nowThis is a popular solution!
Step by stepSolved in 3 steps with 2 images

Knowledge Booster
Similar questions
- One hundred teachers attended a seminar on mathematical problem solving. The attitudes of twelve of the teachers were measured before and after the seminar. A positive number for change in attitude indicates that a teacher's attitude toward math became more positive. The 12 change scores are as follows: 3; 8; -1; 1; 0; 4; -3; 2; -1; 5; 4; -2 what is the standard deviation for this sample? what is the median change score? find the change score that is 2.2 standard deviations below the mean.arrow_forwardNathan takes the State Aptitude Assessment, which has a mean of 350 and a standard deviation of 50. His brother Kyle takes the Regional Readiness Test, which has a mean of 300 and a standard deviation of 45. If Kyle's score was 375, what is the cooresponding z score? a. +2.22 b. +1.00 c. +1.67 d. -1.67arrow_forwardThe ages in years of a random sample of shoppers at a gamming store are shown. 12, 17, 23, 13, 20, 16, 20, 18, 13, 18. Find the range, mean, variance and standard deviation.arrow_forward
- Four students take tests. The results of each test for the class and the student are listed in the choice. Which student has the highest Z Score? a.John who scored an 85 and whose class averages 77 with a standard deviation of 4. b.Tammy who scored an 86 and whose class averages 82 with a standard deviation of 3. c.Rob who scored an 87 and whose class averages 73 with a standard deviation of 11. d.Sandra who scored a 90 and whose class averaged an 81 with a standard deviation of 7.arrow_forwardState whether one would expect the data set described below to be normally distributed. Explain why or why not. The genders of 1,000 randomly selected adultsarrow_forwardFind the mean and stand deviation for each sample. sample A 5,11,17 sample B 77,82,88 sample C 1,075,1,081,1,087arrow_forward
- The weight of football players is normally distributed with a mean of 200 pounds and a standard deviation of 25 pounds. What is the minimum weight of the top 2% of players? Do Not Use Excel. Show the formula used and show your work. Use Z table if neccessary. Group of answer choices 151.75 pounds 251.25 pounds 148.75 pounds 158.25 poundsarrow_forwardYou are considering taking two professors for a statistics course. Both professors have an average of 65%. The first professor has a standard deviation of 1%. The second professor has a standard deviation of 15%. Which professor do you have a better chance of passing with?arrow_forwardUse the Student Unit Load data. Student Unit Load 3, 12, 6, 9, 6, 12, 15, 12, 7, 9, 3 Find the mean, median, mode, range, standard deviation and variance. Use the range rule-of-thumb to find significantly high and low scores. Write the 5-number summary. Find the z-score for x = 15 Is x = 15 unusual in terms of a z-score?arrow_forward
- s Find the population variance and standard deviation for the data set: 10, 60, 50, 30, 40, 20 =>arrow_forwardA population has a mean u = 87 and a standard deviation o = 28. Find the mean and standard deviatio sample sizen=49. =(Simplify your answer.) (Simplify your answer.) Enter your answer in each of the answer boxes. ch %3Darrow_forwardThe ages (in years) of a random sample of shoppers at a gaming store are shown. Determine the range, mean, variance, and standard deviation of the sample data set. 12, 20, 23, 15, 15, 18, 22, 17, 14, 15arrow_forward
arrow_back_ios
SEE MORE QUESTIONS
arrow_forward_ios
Recommended textbooks for you
 MATLAB: An Introduction with ApplicationsStatisticsISBN:9781119256830Author:Amos GilatPublisher:John Wiley & Sons Inc
 Probability and Statistics for Engineering and th...StatisticsISBN:9781305251809Author:Jay L. DevorePublisher:Cengage Learning
 Statistics for The Behavioral Sciences (MindTap C...StatisticsISBN:9781305504912Author:Frederick J Gravetter, Larry B. WallnauPublisher:Cengage Learning
 Elementary Statistics: Picturing the World (7th E...StatisticsISBN:9780134683416Author:Ron Larson, Betsy FarberPublisher:PEARSON
 The Basic Practice of StatisticsStatisticsISBN:9781319042578Author:David S. Moore, William I. Notz, Michael A. FlignerPublisher:W. H. Freeman
 Introduction to the Practice of StatisticsStatisticsISBN:9781319013387Author:David S. Moore, George P. McCabe, Bruce A. CraigPublisher:W. H. Freeman

MATLAB: An Introduction with Applications
Statistics
ISBN:9781119256830
Author:Amos Gilat
Publisher:John Wiley & Sons Inc

Probability and Statistics for Engineering and th...
Statistics
ISBN:9781305251809
Author:Jay L. Devore
Publisher:Cengage Learning

Statistics for The Behavioral Sciences (MindTap C...
Statistics
ISBN:9781305504912
Author:Frederick J Gravetter, Larry B. Wallnau
Publisher:Cengage Learning

Elementary Statistics: Picturing the World (7th E...
Statistics
ISBN:9780134683416
Author:Ron Larson, Betsy Farber
Publisher:PEARSON

The Basic Practice of Statistics
Statistics
ISBN:9781319042578
Author:David S. Moore, William I. Notz, Michael A. Fligner
Publisher:W. H. Freeman

Introduction to the Practice of Statistics
Statistics
ISBN:9781319013387
Author:David S. Moore, George P. McCabe, Bruce A. Craig
Publisher:W. H. Freeman