MATLAB: An Introduction with Applications
6th Edition
ISBN: 9781119256830
Author: Amos Gilat
Publisher: John Wiley & Sons Inc
expand_more
expand_more
format_list_bulleted
Topic Video
Question

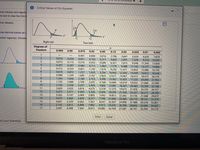
Transcribed Image Text:complete)
Critical Values of Chi-Squared
ical value(s) and rejectid
ne icon to view the Chi-S
ical value(s).
nree decimal places as r
ection region(s). Choose
Right tail
Two tails
Degrees of
freedom
0.995
0.99
0.975
0.95
0.90
0.10
0.05
0.025
0.01
0.005
1
0.001
0.004
0.016
2.706
3.841
5.024
6.635
7.879
0.010
0.020
0.051
0.103
0.211
4.605
5.991
7.378
9.210
10.597
0.072
0.115
0.216
0.352
0.584
6.251
7.815
9.348
11.345
12.838
4
0.207
0.297
0.484
0.711
1.064
7.779
9.488
11.143
13.277
14.860
5
0.412
0.554
0.831
1.145
1.610
9.236
11.071
12.833
15.086
16.750
6.
0.676
0.872
1.237
1.635
2.204
10.645
12.592
14.449
14.067 16.013
16.812
18.548
0.989
1.239
1.690
2.167
2.833
12.017
18.475
17.535 20.090
19.023
20.278
8
1.344
1.646
2.180
2.733
3.325
3.490
13.362
15.507
21.955
9.
1.735
2.088
2.700
4.168
14.684
16.919
21.666
23.589
10
2.156
2.558
3.247
3.940
4,865
15.987
17.275
18.307
20.483
21.920
23.209
25.188
11
2.603
3.053
3.816
4.575
5.578
19.675
24.725
26.757
12
3.074
3.571
4.404
5.226
6.304
18.549
21.026
23.337
26.217
28.299
13
3.565
4.107
5.009
5.892
7.042
19.812
22.362
24.736
27.688
29.819
14
4.075
4.601
4.660
5.629
6.571
7.790
21.064
23.685
26.119 29.141
31.319
15
5.229
6.262
7.261
8.547
22.307
24.996
27.488
30.578
32.801
16
5.812
6.408
6.908
7.564
5.142
7.962
9.312
23.542
24.769
26.296
28.845
32.000 34.267
17
5.697
8.672
10.085
27.587
30.191
33.409
35.718
Print
Done
ect your answer(s).
MacBook Pro

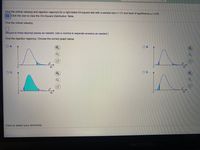
Transcribed Image Text:Find the critical value(s) and rejection region(s) for a right-tailed chi-square test with a sample size n = 21 and level of significance a = 0.05.
EClick the icon to view the Chi-Square Distribution Table.
Find the critical value(s).
(Round to three decimal places as needed. Use a comma to separate answers as needed.)
Find the rejection region(s). Choose the correct graph below.
O A.
O B.
A.
OC.
OD.
55
Click to select your answer(s).
MacBook Pro
Expert Solution
This question has been solved!
Explore an expertly crafted, step-by-step solution for a thorough understanding of key concepts.
This is a popular solution
Trending nowThis is a popular solution!
Step by stepSolved in 3 steps with 3 images

Knowledge Booster
Learn more about
Need a deep-dive on the concept behind this application? Look no further. Learn more about this topic, statistics and related others by exploring similar questions and additional content below.Similar questions
- Heights of adult males are normally distributed. If a large sample of heights of adult males is randomly selected and the heights are illustrated in a histogram, what is the shape of that histogram? Choose the correct answer below. O Bell-shaped Longer tail to the right Longer tail to the left Uniform O 0 o oarrow_forwardRegan is interested in comparing the outdoor activity of people from different parts of the country. He collects data from people from the East Coast, Midwest, and West Coast and assesses how many minutes per day they spend exercising. What test. should i use? ANOVA Paired samples t test Independent samples t test Correlationarrow_forwardHeights of adult males are normally distributed. If a large sample of heights of adult males is randomly selected and the heights are illustrated in a histogram, what is the shape of that histogram? Choose the correct answer below. Uniform O Longer tail to the left O Longer tail to the right O Bell-shaped Carrow_forward
- To determine if their 13 oz filling machine is properly adjusted, Smith Paints has decided to use an X-Chart which uses the range to estimate the variability in the sample. J. Step 1 of 7: What is the Center Line of the control chart? Round your answer to three decimal places. Period 1 2 day Select the Copy Table button to copy all values. To select an entire row or column, either click on the row or column header or use the Shift and arrow keys. To find the average of the selected cells, select the Average Values button. Copy Table Average Values The average of the selected cell(s) is 12.970. Copy Value 3 4 5 6 7 Table Control Chart 8 9 10 11 obs5 obs6 Sample Mean Sample Range 13.02 13.0050 12.97 12.98 13.04 13.04 13.01 13.01 13.03 12.95 12.96 13.05 12.98 12.9967 obs1 obs2 obs3 obs4 13.01 13.01 12.98 13.05 13.02 12.98 12.99 12.97 12.9983 12.98 13.01 13.02 12.96 13.03 13.04 13.0067 13.04 13.04 13.02 13.03 13.02 13.04 13.0317 12.99 12.96 13.03 12.95 12.97 13.05 12.9917 12.98 12.96 12.99…arrow_forwardK The population of ages at inauguration of all U.S. Presidents who had professions in the military is 62, 46, 68, 64, 57. Why does it not make sense to construct a histogram for this data set? Choose the correct answer below. O A. With a data set that is so small, the true nature of the distribution cannot be seen with a histogram. OB. There must be an even number of data values in the data set to create a histogram. OC. This data set would yield a histogram that is not bell-shaped. O D. Adequate class boundaries for a histogram cannot be found with this data set.arrow_forwardUse the standard normal table to find the z-score that corresponds to the given percentile. If the area is not in the table, use the entry closest to the area. If the area is halfway bet two entries, use the -score halfway between the corresponding z-scores. If convenient, use technology to find the z-score. P7arrow_forward
- Eyeglassomatic manufactures eyeglasses for different retailers. They test to see how many defective lenses they made the time period of January 1 to March 31. The table gives the defect and the number of defects. Do the data support the notion that each defect type occurs in the same proportion? Test at the 5% level. Number of Defective Lenses Defect type Number of defects Scratch 1866 Right shaped - small 1935 Flaked 1979 Wrong axis 1921 Chamfer wrong 1864 Crazing, cracks 1991 Wrong shape 2004 Wrong PD 1895 Spots and bubbles 1917 Wrong height 1885 Right shape - big 1875 Lost in lab 1886 Spots/bubble - intern 1935 State the hypotheses.H0: Each defect type in the same proportion.Ha: Each defect type in the same proportion. Calculate the χ2 test statistic. Round expected values to two decimal places. Round χ2 to three decimal places.χ2 = Calculate the p-value. Round to four decimal places.p-value = State your decision.Since p-value 0.05,…arrow_forwardSuppose that you are using independent samples to compare two population proportions. Fill in the blanks. a. The mean of all possible differences between the two sample proportions equals the_______.b. For large samples, the possible differences between the two samplel proportions have approximately a_________distribution.arrow_forwardDraw the box-and-whisker plot and give the five-number summary for each data set. Number of games won by the Detroit Lions in their last 10 seasons: minumim:________ (9,7,11,7,4,10,6,2,0,7) Lower Quartile:________ Median:______________ Upper Quartile:_____________ Maximum_______________arrow_forward
- Please determine the critical valuearrow_forwardRefer to the data set in the accompanying table. Assume that the paired sample data is a simple random sample and the differences have a distribution that is approximately normal. Use a significance level of 0.05 to test for a difference between the weights of discarded paper (in pounds) and weights of discarded plastic (in pounds). E Click the icon to view the data. In this example, Hg is the mean value of the differences d for the population of all pairs of data, where each individual difference d is defined as the weight of discarded paper minus the weight of discarded plastic for a household. What are the null and alternative hypotheses for the hypothesis test? O A. Ho: Ha = 0 H,: Ha #0 O B. Ho: Ha #0 H1: Hd =0 O C. Ho: Ha #0 O D. Ho: Ha = 0 H1: Hd 0arrow_forwardOnly answer part C, use Part B and the chart if needed.arrow_forward
arrow_back_ios
SEE MORE QUESTIONS
arrow_forward_ios
Recommended textbooks for you
 MATLAB: An Introduction with ApplicationsStatisticsISBN:9781119256830Author:Amos GilatPublisher:John Wiley & Sons Inc
 Probability and Statistics for Engineering and th...StatisticsISBN:9781305251809Author:Jay L. DevorePublisher:Cengage Learning
 Statistics for The Behavioral Sciences (MindTap C...StatisticsISBN:9781305504912Author:Frederick J Gravetter, Larry B. WallnauPublisher:Cengage Learning
 Elementary Statistics: Picturing the World (7th E...StatisticsISBN:9780134683416Author:Ron Larson, Betsy FarberPublisher:PEARSON
 The Basic Practice of StatisticsStatisticsISBN:9781319042578Author:David S. Moore, William I. Notz, Michael A. FlignerPublisher:W. H. Freeman
 Introduction to the Practice of StatisticsStatisticsISBN:9781319013387Author:David S. Moore, George P. McCabe, Bruce A. CraigPublisher:W. H. Freeman

MATLAB: An Introduction with Applications
Statistics
ISBN:9781119256830
Author:Amos Gilat
Publisher:John Wiley & Sons Inc

Probability and Statistics for Engineering and th...
Statistics
ISBN:9781305251809
Author:Jay L. Devore
Publisher:Cengage Learning

Statistics for The Behavioral Sciences (MindTap C...
Statistics
ISBN:9781305504912
Author:Frederick J Gravetter, Larry B. Wallnau
Publisher:Cengage Learning

Elementary Statistics: Picturing the World (7th E...
Statistics
ISBN:9780134683416
Author:Ron Larson, Betsy Farber
Publisher:PEARSON

The Basic Practice of Statistics
Statistics
ISBN:9781319042578
Author:David S. Moore, William I. Notz, Michael A. Fligner
Publisher:W. H. Freeman

Introduction to the Practice of Statistics
Statistics
ISBN:9781319013387
Author:David S. Moore, George P. McCabe, Bruce A. Craig
Publisher:W. H. Freeman