
MATLAB: An Introduction with Applications
6th Edition
ISBN: 9781119256830
Author: Amos Gilat
Publisher: John Wiley & Sons Inc
expand_more
expand_more
format_list_bulleted
Related questions
Question

Transcribed Image Text:**Hypothesis Testing Using P-Value Approach**
**Objective:**
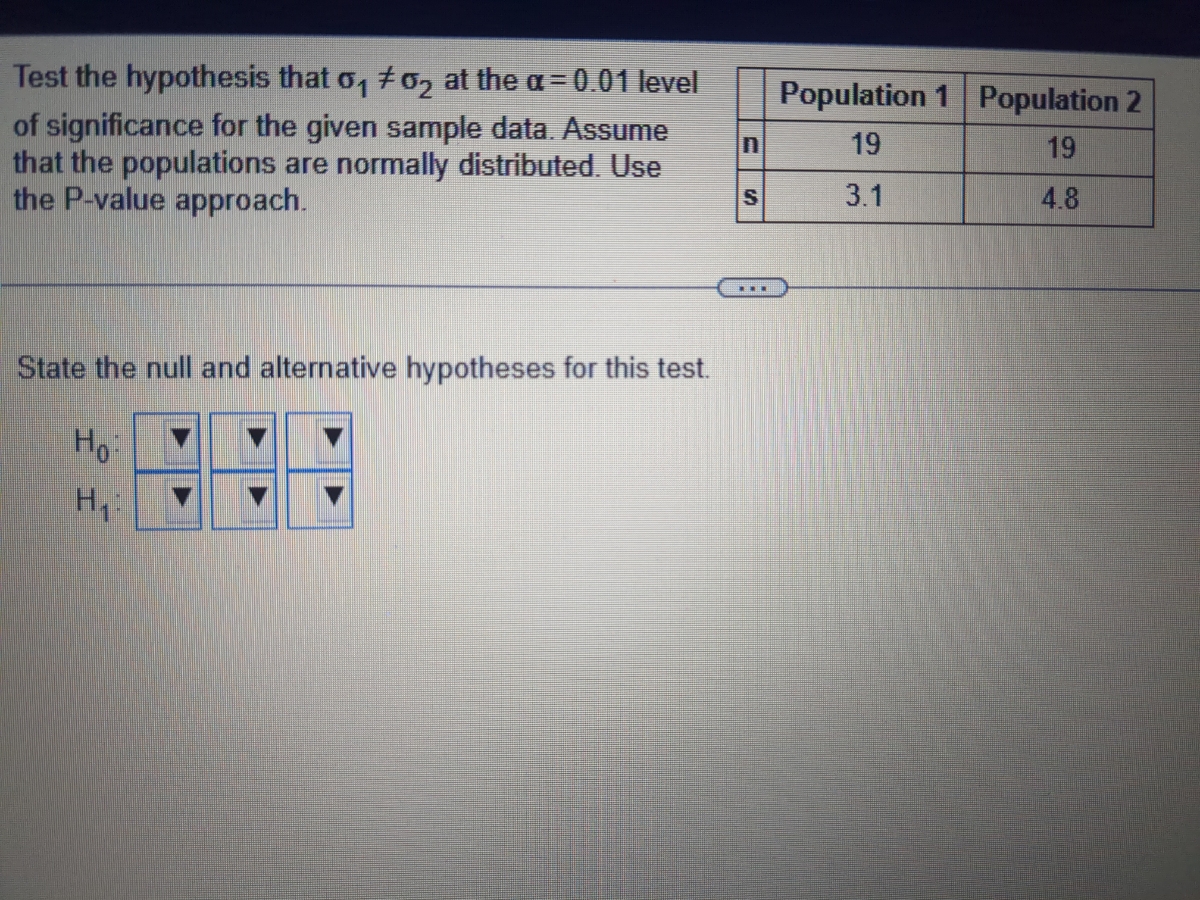
Test the hypothesis that the population standard deviations \( \sigma_1 \neq \sigma_2 \) at the \( \alpha = 0.01 \) level of significance for the given sample data. Assume that the populations are normally distributed.
**Data:**
- **Population 1:**
- Sample size (\( n \)): 19
- Sample standard deviation (\( s \)): 3.1
- **Population 2:**
- Sample size (\( n \)): 19
- Sample standard deviation (\( s \)): 4.8
**Instructions:**
1. **State the Hypotheses:**
- **Null Hypothesis (\( H_0 \)):** \( \sigma_1 = \sigma_2 \)
- **Alternative Hypothesis (\( H_1 \)):** \( \sigma_1 \neq \sigma_2 \)
2. **Use the P-value Approach:**
- Calculate the test statistic.
- Determine the p-value.
- Compare the p-value to the significance level (\( \alpha = 0.01 \)).
- Draw conclusions based on the comparison.
**Note:** Ensure data is normally distributed to correctly apply the test.
Expert Solution
This question has been solved!
Explore an expertly crafted, step-by-step solution for a thorough understanding of key concepts.

Step by stepSolved in 2 steps

Knowledge Booster

Similar questions
- A study was done using a treatment group and a placebo group. The results are shown in the table. Assume that the two samples are independent simple random samples selected from normally distributed populations, and do not assume that the population standard deviations are equal. Complete parts (a) and (b) below. Use a 0.10 significance level for both parts. a. Test the claim that the two samples are from populations with the same mean. What are the null and alternative hypotheses? OA. Ho H1 H2 H₁: H1 H2 o C. Ho: H = 2 H₁: H1 H2 OB. Ho: H1 H2 H1 H1 H2 OD. Ho H1 H2 H₁: 12 Treatment Placebo μ H1 H2 n 27 31 X 2.35 2.65 S 0.95 0.55arrow_forwardQuestion Help Instructor-created question Sham Magnet H1 Researchers conducted a study to determine whether magnets can affect back pain. The results are shown in the table for the treatment (with magnets) group and the sham (or placebo) group. The results are a measure of reduction in back pain. Assume that the two samples H are independent simple random samples selected from normally distributed populations, and do not assume that the population standard deviations are equal. Use a 0.05 significance level to test thế claim that those treated with magnets have a different mean reduction in than those given a sham treatment. P2 10 10 0.54 0.45 5. 0.62 1.49 pain What are the null and alternative hypotheses? O A. Ho: H1 H2 O C. Ho H1 H2 O D. Ho: H1= H2 H1 P1 H2 ents Upper critical value is: (Round to three decimal places as needed.) Lower critical value is: (Round to three decimal places as needed.) cess Library Click to select your answer(s) and then click Check Answer. Clear All Check…arrow_forwardsanjayarrow_forward
- I need help on this practice problemarrow_forwardTest the claim below about the mean of the differences for a population of paired data at the level of significance a. Assume the samples are random and dependent, and the populations are normally distributed. Claim: H. 20; a = 0.05. Sample statistics: d= - 2.2, s, = 1.5, n= 14 Identify the null hypothesis by writing its complement. OB. Ho: Ha s0 OA Ho: Ha #0 H: Ha =0 OD. Ho: Ha0 VE. Ho: Ha20 Ha: Hd <0 The test statistic is t= (Round to two decimal places as needed.)arrow_forwardFind test statistic and P value And state conclusion for the testarrow_forward
- Determine P-Value.arrow_forwardUse a y-test to test the claim o 35 H, o35 hir winga H, o>35 Identify the test statistic. 18.652 (Round to three decimal places as needed.) me Identify the critical value(s). nts (Round to three decimal places as needed. Use a comma to separate answers as needed.) t: C k Contents edia Library View an example Get more help - Clear all Check answer Help me solve this Plan ior SucceSE 72°F A a a 99+ P Type here to search 10/05/17 Delete PrtSc Insert F12 E11arrow_forwardThanksarrow_forward
- Test the claim below about the mean of the differences for a population of paired data at the level of significance a. Assume the samples are random and dependent, and the populations are normally distributed. Claim: H 0 H Ha sO O E. Ho Hd0 F. Ho: Hg20 The test statistic is t= (Round to two decimal places as needed.) Enter your answer in the answer box and then click Check Answer. parts remaining Clear All Check Answer les7e_ppt_08_03.pptx Open file Show all 2:28 PM P Type here to search A di 2/21/2021 ho * h2 ) break end prt sc inser f7 f9 16 1. fe多 home esc 24 4 %3D 3. 5. 6. 7. 8.arrow_forwardViolation of which assumption below for the two-factor ANVOA is not a cause for concern with large sample sizes? a. The populations from which the samples are selected must have equal variances. b. The populations from which the samples are selected must be normal. c. A violation of any assumption below would be a concern, even with large sample sizes. d. The observations within each sample must be independent.arrow_forwardidentify the test statistic. Identify the P-value.arrow_forward
arrow_back_ios
SEE MORE QUESTIONS
arrow_forward_ios
Recommended textbooks for you
- MATLAB: An Introduction with ApplicationsStatisticsISBN:9781119256830Author:Amos GilatPublisher:John Wiley & Sons Inc
 Probability and Statistics for Engineering and th...StatisticsISBN:9781305251809Author:Jay L. DevorePublisher:Cengage Learning
 Statistics for The Behavioral Sciences (MindTap C...StatisticsISBN:9781305504912Author:Frederick J Gravetter, Larry B. WallnauPublisher:Cengage Learning
  Elementary Statistics: Picturing the World (7th E...StatisticsISBN:9780134683416Author:Ron Larson, Betsy FarberPublisher:PEARSON
 The Basic Practice of StatisticsStatisticsISBN:9781319042578Author:David S. Moore, William I. Notz, Michael A. FlignerPublisher:W. H. Freeman
 Introduction to the Practice of StatisticsStatisticsISBN:9781319013387Author:David S. Moore, George P. McCabe, Bruce A. CraigPublisher:W. H. Freeman
MATLAB: An Introduction with Applications
Statistics
ISBN:9781119256830
Author:Amos Gilat
Publisher:John Wiley & Sons Inc
Probability and Statistics for Engineering and th...
Statistics
ISBN:9781305251809
Author:Jay L. Devore
Publisher:Cengage Learning
Statistics for The Behavioral Sciences (MindTap C...
Statistics
ISBN:9781305504912
Author:Frederick J Gravetter, Larry B. Wallnau
Publisher:Cengage Learning
Elementary Statistics: Picturing the World (7th E...
Statistics
ISBN:9780134683416
Author:Ron Larson, Betsy Farber
Publisher:PEARSON
The Basic Practice of Statistics
Statistics
ISBN:9781319042578
Author:David S. Moore, William I. Notz, Michael A. Fligner
Publisher:W. H. Freeman
Introduction to the Practice of Statistics
Statistics
ISBN:9781319013387
Author:David S. Moore, George P. McCabe, Bruce A. Craig
Publisher:W. H. Freeman