
MATLAB: An Introduction with Applications
6th Edition
ISBN: 9781119256830
Author: Amos Gilat
Publisher: John Wiley & Sons Inc
expand_more
expand_more
format_list_bulleted
Related questions
Question
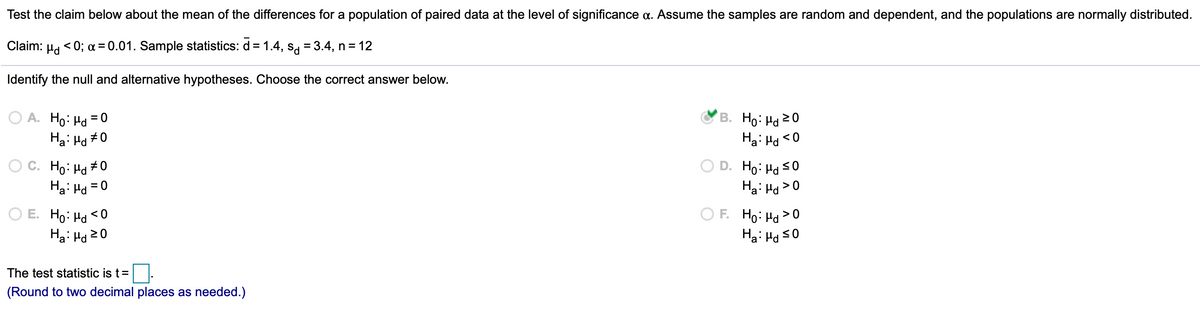

Transcribed Image Text:Test the claim below about the mean of the differences for a population of paired data at the level of significance a. Assume the samples are random and dependent, and the populations are normally distributed.
Claim:
< 0; a = 0.01. Sample statistics: d= 1.4, sg = 3.4, n= 12
%3D
Identify the null and alternative hypotheses. Choose the correct answer below.
O A. Ho: Ha =0
Ha: Hd
B. Ho: Hd 20
Ha: Hd <0
O C. Ho: Ha + 0
Ha: Hd =0
D. Ho: Hd s0
Ha: Hd >0
O E. Ho: Ha < 0
Ha: Hd20
F. Ho: Ha >0
Ha: Hd so
The test statistic is t=
(Round to two decimal places as needed.)
Expert Solution
This question has been solved!
Explore an expertly crafted, step-by-step solution for a thorough understanding of key concepts.

This is a popular solution

Trending nowThis is a popular solution!

Step by stepSolved in 2 steps

Knowledge Booster


Learn more about
Need a deep-dive on the concept behind this application? Look no further. Learn more about this topic, statistics and related others by exploring similar questions and additional content below.Similar questions
- For the last sentence / first blank is choices in/not in . second blank is fail to reject/ reject third blank is is not /isarrow_forwardIn the independent measures t-test, what is assumed by the homogeneity of variance assumption? a. The two samples have equal variances. b. The two sample variances are not equal. c. The two populations have equal variances. d. The two population variances are not equal.arrow_forwardListed below are the lead concentrations in mu g/g measured in different traditional medicines. Use a 0.05 significance level to test the claim that the mean lead concentration for all such medicines is less than 15 mu g/g. Assume that the sample is a simple random sample. a. Determine the test statistic. (Round to two decimal places as needed.) b. Determine the P-value. (Round to three decimal places as needed.)arrow_forward
- A. Determine the test statistic B. Determine the P-value C.reject or fail to reject H0arrow_forwardConsider the data below. Three random samples in different cities were selected. Water use per household per day were measured. Test the claim that the samples come from populations with the same mean. Assume all requirements have been met. Use a 5% level of significance. 1. Identify the tail of the test. [ Select ] 2. Find the P-value. [ Select ] 3. Will the null hypothesis be rejected? [ Select ] 4. Do the populations appear to have the same mean? [ Select ] Sample Data City 1 City 2 City 3 70 66 66 70 64 66 55 45 54 60 41 61 65 58 65 45 44 65 55 46arrow_forwardDecide whether the normal sampling distribution can be used. If it can be used, test the claim about the difference between two population proportions p, and p, at the given level of significance a using the given sample statistics. Assume the sample statistics are from independent random samples. Claim: P1 = P2, a = 0.10 Sample statistics: X1 = 108, n, = 128 and x, = 32, n, = 195 ... Ha: P1 7 P2 O E. Anormal sampling distribution cannot be used, so the claim cannot be tested. Find the critical values. Select the correct choice below and, if necessary, fill in the answer boxes to complete your choice. A. The critical values are - z, = 1.28 and zo =1.28 (Round to two decimal places as needed.) B. A normal sampling distribution cannot be used, so the claim cannot be tested. Find the standardized test statistic. Select the correct choice below and, if necessary, fill in the answer box to complete your choice. A. (Round to two decimal places as needed.) Z= B. A normal sampling distribution…arrow_forward
- A researcher is interested in whether there is a difference between male and female college students in the amount of time spent doing volunteer work for the last 6 months. The researcher gathers a random sample of college students. The amount of time volunteering is measured in hours, which is an interval level-ratio and is normally distributed. Which statistical test should be used to analyze this data? a. Multiple regression b. paired samples t-test c. independent groups t-test d. Factorial ANOVAarrow_forwardThe "Freshman 15" refers to the belief that college students gain 15 lb (or 6.8 kg) during their freshman year. Listed in the accompanying table are weights (kg) of randomly selected male college freshmen. The weights were measured in September and later in April. Use the listed paired sample data, and assume that the samples are simple random samples and that the differences have a distribution that is approximately normal. Complete parts (a) through (c). = 0 kg Ho: Ha H₁: Hd > 0 kg (Type integers or decimals. Do not round.) Identify the test statistic. t = 2.82 (Round to two decimal places as needed.) Identify the P-value. a. Use a 0.05 significance level to test the claim that for the population of freshman male college students, the weights in September are less than the weights in the following April. In this example, is the mean value of the differences d for the population of all pairs of data, where each individual difference d is defined as the April weight minus the September…arrow_forwardAccording to data released by the Organization for Economic Cooperation and Development (OECD) in 2018, the French spend more time eating their meals than anybody else. Perform a hypothesis test to determine if a difference exists between the average time an American spends eating lunch when compared to a person from France. The given data represents the time, in minutes, that random French and American diners spent at lunch. Assume that the population variances are equal. American 21 French 24 17 18 O A. tx=2.34 O B. t=1.41 O C. t = 1.63 O D. t = -2.20 X 17 20 20 28 25 16 18 29 17 20 16 If Population 1 is defined as French diners and Population 2 is defined as American diners, then what is the test statistic for this hypothesis test? Round to two decimal places as needed. Clear all Check answerarrow_forward
- Listed in the accompanying table are heights (in.) of mothers and their first daughters. The data pairs are from a journal kept by Francis Galton. Use the listed paired sample data, and assume that the samples are simple random samples and that the differences have a distribution that is approximately normal. Use a 0.05 significance level to test the claim that there is no difference in heights between mothers and their first daughters. Mother 64.0 66.0 63.0 62.0 66.5 66.0 65.0 60.0 67.0 63.0 Daughter 67.0 66.5 70.5 66.0 61.0 66.0 65.5 65.0 67.0 65.0 In this example, Hd is the mean value of the differences d for the population of all pairs of data, where each individual difference d is defined as the daughter's height minus the mother's height. What are the null and alternative hypotheses for the hypothesis test? Ho: Ha = 0 in. H₁ Hd 0 in. (Type integers or decimals. Do not round.) Identify the test statistic. t= (Round to two decimal places as needed.)arrow_forwardUse technology to help you test the claim about the population mean, µ, at the given level of significance, a, using the given sample statistics. Assume the population is normally distributed. Claim: µ> 1170; a = 0.07; o = 212.01. Sample statistics: x= 1185.03, n= 300 Identify the null and alternative hypotheses. Choose the correct answer below. Ο Α. Ho μ2 1185.03 Ο Β. Ho : με 1185.03 Ha: µ 1185.03 O C. H μ2 1170 O D. Ho: µ> 1170 Ha: H 1185.03 Ha: µ> 1170 Ha: us1185.03 Calculate the standardized test statistic. The standardized test statistic is (Round to two decimal places as needed.) Determine the P-value. P = (Round to three decimal places as needed.) Determine the outcome and conclusion of the test. Ho. At the 7% significance level, there enough evidence to the claim.arrow_forwardWhich of the following is NOT a requirement of testing a claim about the mean of the differences from dependent samples? Choose the correct answer below. O A. The degrees of freedom aren- 2. O B. The samples are simple random samples. O C. The sample data are dependent. O D. Either the number of pairs of sample data is larger than 30 or the pairs have differences that are from a population having a distribution that is approximately normal, or both.arrow_forward
arrow_back_ios
SEE MORE QUESTIONS
arrow_forward_ios
Recommended textbooks for you
- MATLAB: An Introduction with ApplicationsStatisticsISBN:9781119256830Author:Amos GilatPublisher:John Wiley & Sons Inc
 Probability and Statistics for Engineering and th...StatisticsISBN:9781305251809Author:Jay L. DevorePublisher:Cengage Learning
 Statistics for The Behavioral Sciences (MindTap C...StatisticsISBN:9781305504912Author:Frederick J Gravetter, Larry B. WallnauPublisher:Cengage Learning
  Elementary Statistics: Picturing the World (7th E...StatisticsISBN:9780134683416Author:Ron Larson, Betsy FarberPublisher:PEARSON
 The Basic Practice of StatisticsStatisticsISBN:9781319042578Author:David S. Moore, William I. Notz, Michael A. FlignerPublisher:W. H. Freeman
 Introduction to the Practice of StatisticsStatisticsISBN:9781319013387Author:David S. Moore, George P. McCabe, Bruce A. CraigPublisher:W. H. Freeman
MATLAB: An Introduction with Applications
Statistics
ISBN:9781119256830
Author:Amos Gilat
Publisher:John Wiley & Sons Inc
Probability and Statistics for Engineering and th...
Statistics
ISBN:9781305251809
Author:Jay L. Devore
Publisher:Cengage Learning
Statistics for The Behavioral Sciences (MindTap C...
Statistics
ISBN:9781305504912
Author:Frederick J Gravetter, Larry B. Wallnau
Publisher:Cengage Learning
Elementary Statistics: Picturing the World (7th E...
Statistics
ISBN:9780134683416
Author:Ron Larson, Betsy Farber
Publisher:PEARSON
The Basic Practice of Statistics
Statistics
ISBN:9781319042578
Author:David S. Moore, William I. Notz, Michael A. Fligner
Publisher:W. H. Freeman
Introduction to the Practice of Statistics
Statistics
ISBN:9781319013387
Author:David S. Moore, George P. McCabe, Bruce A. Craig
Publisher:W. H. Freeman