
MATLAB: An Introduction with Applications
6th Edition
ISBN: 9781119256830
Author: Amos Gilat
Publisher: John Wiley & Sons Inc
expand_more
expand_more
format_list_bulleted
Related questions
Question
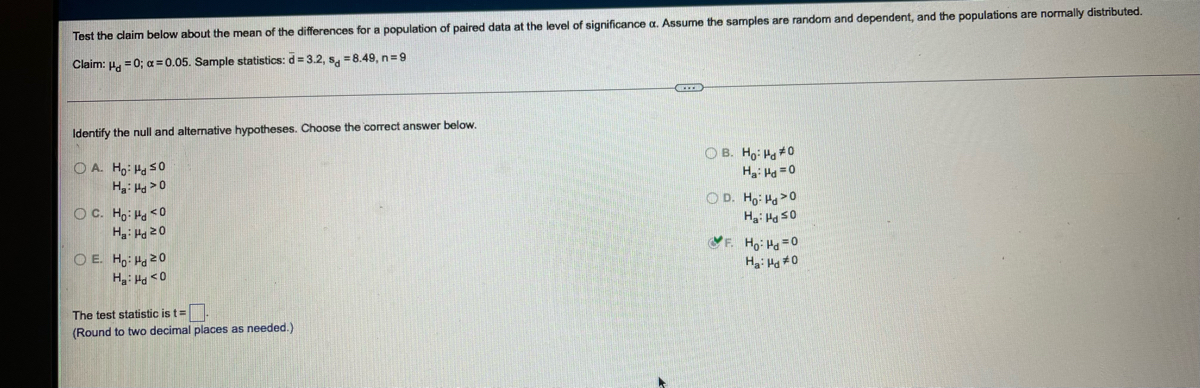

Transcribed Image Text:Test the claim below about the mean of the differences for a population of paired data at the level of significance a. Assume the samples are random and dependent, and the populations are normally distributed.
Claim: H. = 0; a 0.05. Sample statistics: d = 3.2, s, =8.49, n=9
Identify the null and alternative hypotheses. Choose the correct answer below.
O B. Ho: Ha 0
H: Hg =0
O A. Ho: Ha s0
H: Hg>0
O D. Ho: Ha>0
H: Hg sO
OC. H,: Ha <0
Ha: Ha 20
O E. H, Ha 20
F. Ho: Ha=0
Ha: H #0
The test statistic is t=
(Round to two decimal places as needed.)
Expert Solution
This question has been solved!
Explore an expertly crafted, step-by-step solution for a thorough understanding of key concepts.

This is a popular solution

Trending nowThis is a popular solution!

Step by stepSolved in 2 steps with 2 images

Knowledge Booster

Similar questions
- Assume that you want to test the claim that the paired sample data below come from a population from which the mean difference is zero. Using JMP, compute the value of the appropriate test statistic. Do the data appear to come from a population where the mean difference is zero? X: 28 35 25 25 32 30 28 37 Y: 26 31 31 25 33 35 28 33 a. No b. O c. Yes d.arrow_forwardAssume that you want to test the claim paired sample data come from a population for which the mean difference is ud=0. Compute the value of the t test statistic. X 28 35 25 25 32 30 28 34 Y 26 31 31 25 33 35 28 33arrow_forwardThe "Freshman 15" refers to the belief that college students gain 15 lb (or 6.8 kg) during their freshman year. Listed in the accompanying table are weights (kg) of randomly selected male college freshmen. The weights were measured in September and later in April. Use the listed paired sample data, and assume that the samples are simple random samples and that the differences have a distribution that is approximately normal. Complete parts (a) through (c). September 49 52 54 56 59 74 64 75 74 April 50 53 56 58 62 78 68 82 69 a. Use a 0.01 significance level to test the claim that for the population of freshman male college students, the weights in September are less than the weights in the following April. In this example, Had is the mean value of the differences d for the population of all pairs of data, where each individual difference d is defined as the April weight minus the September weight. Whe are the null and alternative hypotheses for the hypothesis test? Ho Hd 0 kg H₁ Hd >0…arrow_forward
- Assume the samples are random and independent, the populations are nomally distributed, and the population variances are equal. The table available below shows the prices (in dollars) for a sample of automobile batteries. The prices are classified according to battery type. At a = 0.10, is there enough evidence conclude that at least one mean battery price is different from the others? Complete parts (a) through (e) below. E Click the icon to view the battery cost data. (a) Let u1. P2. H3 represent the mean prices for the group size 35, 65, and 24/24F respectively. Identify the claim and state Ho and H. H Cost of batteries by type The claim is the V hypothesis. Group size 35 Group size 65 Group size 24/24F 101 111 121 124 D 146 173 182 278 124 140 141 89 (b) Find the critical value, Fo, and identify the rejection region. 90 79 84 The rejection region is F Fo, where Fo = (Round to two decimal places as needed.) (c) Find the test statistic F. Print Done F= (Round to two decimal places as…arrow_forwardWhich of the following is TRUE about the mean of the sampling distribution of the sample means? It is less than the population mean. It is not related to the population mean. It is equal to the population mean. It is greater than the population mean.arrow_forwardDII Given below are the sample means for fifteen samples consisting of five data values each. Assume that the mean of the sample means is ten and the computed values for the UCL and LCL of the chart are 15 and 5, respectively. Below is the chart. Is this process in statistical control? Why or why not? Select the best answer choice. Sample 1 2 3 Mean 9 11 6 17+ 16- 15 14+ 13+ 12+ 11+ 10- 9. 8+ 7- 6 5 4. 3- 2- 1- R Submit Question $ F4 % -1 + O No, because there are eight consecutive points all above or all below the centerline. O No, because there is a point lying beyond the upper or lower control limit. O No, because there is a pattern, trend, or cycle that is obviously not random. O No, because more than one of the answer choices above are correct. O Yes, this process is within statistical control. 5 T 4 5 12 9 ▬▬ FS 6 7 8 11 7 8 6 6 Y H 49 9 10 12 16 F6 8 & 7 9 U 11 12 6 13 J 10 F7 11 13 14 15 12 11 7 8 12 PrtScn 13 FB K 15 9 UCL centerline LCL Home 16 Q F9 L ) End 0 F10 A PgUp ☎arrow_forward
- Question Help Y 12.2.79 The number of successes and the sample size for a simple random sample from a population are given below. x = 8, n = 40, Ho:p=0.4, H2: p< 0.4, a = 0.01 a. Determine the sample proportion. b. Decide whether using the one-proportion z-test is appropriate. c. If appropriate, use the one-proportion z-test to perform the specified hypothesis test. Click here to view a table of areas under the standard normal curve for negative values of z. Click here to view a table of areas under the standard normal curve for positive values of z. c. Determine the test statistic, if appropriate. Select the correct choice below and, if necessary, fill in the answer box to complete your answer. z= - 2.58 (Round to two decimal places as needed.) B. The one-proportion z-test is not appropriate. Identify the critical value(s), if appropriate. Select the correct choice below and, if necessary, fill in the answer box to complete your answer. A. ±Za/2 (Round to two decimal places as…arrow_forwardneed help asap!arrow_forwardFind the standardized test statistic estimate, z, to test the hypothesis that p, > p,. Use a= 0.01. The sample statistics listed below are from independent samples. Round to three decimal places. Sample statistics: n, = 100, x, = 38, and n2 = 140, X2 = 50 %3D %D O A. 0.638 B. 0.362 O C. 2.116 D. 1.324 S ting Click to select your answer. Type here to search hp 近arrow_forward
- Available below are amounts of arsenic in samples of brown rice from three different regions. The amounts are in micrograms of arsenic and all samples have the same serving size. Use a 0.05 significance level to test the claim that the three samples are from populations with the same mean. Do the amounts of arsenic appear to be different in the different regions? Given that the amounts of arsenic in the samples from region C have the highest mean, can we conclude that brown rice from region C poses the greatest health problem? view the data table of the arsenic amounts. Arsenic Amounts (micrograms) A 4.9 4.9 4.9 5.2 5.3 5.5 5.6 5.7 5.8 5.9 6.1 6.3 B 2.3 3.6 4.5 4.6 4.8 4.8 4.8 5.1 5.1 5.4 5.4 5.5 C 5.7 5.7 6.7 6.9 7.1 7.2 7.2 7.3 7.3 7.4 7.5 7.6 What are the hypotheses to test? H0: mu 1 equals mu 2 equals mu 3μ1=μ2=μ3 H1: At least one…arrow_forwardWhat does the t test for the difference between the means of 2 independent populations assume? A. The sample sizes are equal. B. The sample variances are equal. C. The populations are approximately normal. D. All of the abovearrow_forwardSolve the problem. Find the standardized test statistic t for a sample with n = 15, x = 8.7, s = 0.8, and a = 0.05 if Ho: Hs 8.4. Round your answer to three decimal places. a. 1.452 b. 1.631 c. 1.728 d. 1.312arrow_forward
arrow_back_ios
SEE MORE QUESTIONS
arrow_forward_ios
Recommended textbooks for you
- MATLAB: An Introduction with ApplicationsStatisticsISBN:9781119256830Author:Amos GilatPublisher:John Wiley & Sons Inc
 Probability and Statistics for Engineering and th...StatisticsISBN:9781305251809Author:Jay L. DevorePublisher:Cengage Learning
 Statistics for The Behavioral Sciences (MindTap C...StatisticsISBN:9781305504912Author:Frederick J Gravetter, Larry B. WallnauPublisher:Cengage Learning
  Elementary Statistics: Picturing the World (7th E...StatisticsISBN:9780134683416Author:Ron Larson, Betsy FarberPublisher:PEARSON
 The Basic Practice of StatisticsStatisticsISBN:9781319042578Author:David S. Moore, William I. Notz, Michael A. FlignerPublisher:W. H. Freeman
 Introduction to the Practice of StatisticsStatisticsISBN:9781319013387Author:David S. Moore, George P. McCabe, Bruce A. CraigPublisher:W. H. Freeman
MATLAB: An Introduction with Applications
Statistics
ISBN:9781119256830
Author:Amos Gilat
Publisher:John Wiley & Sons Inc
Probability and Statistics for Engineering and th...
Statistics
ISBN:9781305251809
Author:Jay L. Devore
Publisher:Cengage Learning
Statistics for The Behavioral Sciences (MindTap C...
Statistics
ISBN:9781305504912
Author:Frederick J Gravetter, Larry B. Wallnau
Publisher:Cengage Learning
Elementary Statistics: Picturing the World (7th E...
Statistics
ISBN:9780134683416
Author:Ron Larson, Betsy Farber
Publisher:PEARSON
The Basic Practice of Statistics
Statistics
ISBN:9781319042578
Author:David S. Moore, William I. Notz, Michael A. Fligner
Publisher:W. H. Freeman
Introduction to the Practice of Statistics
Statistics
ISBN:9781319013387
Author:David S. Moore, George P. McCabe, Bruce A. Craig
Publisher:W. H. Freeman