
MATLAB: An Introduction with Applications
6th Edition
ISBN: 9781119256830
Author: Amos Gilat
Publisher: John Wiley & Sons Inc
expand_more
expand_more
format_list_bulleted
Related questions
Question
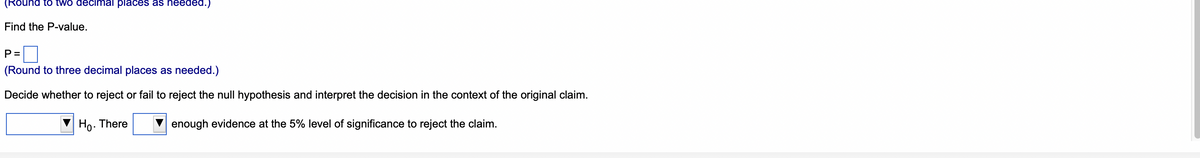

Transcribed Image Text:(Round to two decimal places as needed.)
Find the P-value.
P =
(Round to three decimal places as needed.)
Decide whether to reject or fail to reject the null hypothesis and interpret the decision in the context of the original claim.
Ho. There
enough evidence at the 5% level of significance to reject the claim.

Transcribed Image Text:Test the claim about the difference between two population means µ, and u, at the level of significance a. Assume the samples are random and independent, and the populations are normally distributed.
Claim: µ, sH2; a = 0.05. Assume o, #o,
Sample statistics: X1 = 2403, s, = 171, n, = 15 and
X2 = 2299, s2 = 55, n2 = 11
...
Identify the null and alternative hypotheses. Choose the correct answer below.
O A. Ho: H1 =H2
Ha: H1 # H2
B. Ho: H12 H2
Ha: H1 <H2
O C. Ho: H1 # H2
Ha: H1 = H2
D. Ho: H1 SH2
Hai H1> H2
E. Ho: H1 <H2
Hai H12 H2
O F. Ho: H1 > H2
Find the standardized test statistic t.
t=
(Round to two decimal places as needed.)
Find the P-value.
P =
(Round to three decimal places as needed.)
Decide whether to reject or fail to reject the null hypothesis and interpret the decision in the context of the original claim.
Expert Solution
This question has been solved!
Explore an expertly crafted, step-by-step solution for a thorough understanding of key concepts.

Step by stepSolved in 4 steps

Knowledge Booster

Similar questions
- Given in the table are the BMI statistics for random samples of men and women. Assume that the two samples are independent simple random samples selected from normally distributed populations, and do not assume that the population standard deviations are equal. Complete parts (a) and (b) below. Use a 0.01 significance level for both parts. a. Test the claim that males and females have the same mean body mass index (BMI). What are the null and alternative hypotheses? OA. Ho: H₁ H₂ H₁: H₁ H₂ OC. Ho: H₁ H₂ H₁ H₁ H₂ The test statistic, t, is The P-value is (Round to two decimal places as needed.) (Round to three decimal places as needed.) State the conclusion for the test. C O B. Ho: H=H2 H₁: H₁ H₂ OD. Ho Hy#t H₁: H₁ H₂ O A. Reject the null hypothesis. There is not sufficient evidence to warrant rejection of the claim that men and women have the same mean BMI. O B. Fail to reject the null hypothesis. There is sufficient evidence to warrant rejection of the claim that men and women have the…arrow_forwardListed below are systolic blood pressure measurements (mm Hg) taken from the right and left arms of the same woman. Assume that the paired sample data is a simple random sample and that the differences have a distribution that is approximately normal. Use a 0.10 significance level to test for a difference between the measurements from the two arms. What can be concluded? Right arm 142 132 127 137 130 D Left arm 174 172 184 137 147 O A. Ho: Hd =0 B. Ho: Ha 0 H1: Hd =0 %3D OC. Ho: Hd = 0 H1: Hd 0 Identify the test statistic. (Round to two decimal places as needed.) t= Identify the P-value. P-value = (Round to three decimal places as needed.) What is the conclusion based on the hypothesis test?arrow_forward10. Claim: P₁ = P₂; α = 0.05. Sample statistics: x1 = 265, n₁ - X2 204, 2 - 301, 247 'Darrow_forward
- Data on the weights (Ib) of the contents of cans of diet soda versus the contents of cans of the regular version of the soda is summarized to the right. Assume that the two samples are independent simple random samples selected from normally distributed populations, and do not assume that the population standard deviations are equal. Complete parts (a) and (b) below. Use a 0.01 significance level for both parts. Diet Regular H2 27 27 0.79037 lb 0.80399 lb 0.00449 lb 0.00756 lb a. Test the claim that the contents of cans of diet soda have weights with a mean that is less than the mean for the regular soda. What are the null and alternative hypotheses? O A. Ho: H1 = H2 OB. Ho: H1#H2 Hq: Hyarrow_forwardFind the standardized test statistic, z to test the claim that p, = p2. The sample statistics listed below are from independent samples. n1 = 50, x1 = 35, and n2 = 60, x2 = 40 ... О А. 1.328 В. 2.361 С. О.374 O D. 0.982arrow_forwardFind the standardized test statistic estimate, z, to test the hypothesis that p, > p,. Use a= 0.01. The sample statistics listed below are from independent samples. Round to three decimal places. Sample statistics: n, = 100, x, = 38, and n2 = 140, X2 = 50 %3D %D O A. 0.638 B. 0.362 O C. 2.116 D. 1.324 S ting Click to select your answer. Type here to search hp 近arrow_forward
- I need help with this one please thank youarrow_forwardI need help finding the test statistic and the P-valuearrow_forwardGiven in the table are the BMI statistics for random samples of men and women. Assume that the two samples are independent simple random samples selected from normally distributed populations, and do not assume that the population standard deviations are equal. Complete parts (a) and (b) below. a. Use a 0.05 significance level, and test the claim that males and females have the same mean body mass index (BMI). What are the null and alternative hypotheses? OA. Ho: H₁ H₂ H₁ H₁ H₂ OC. Ho: H₁ H₂ H₁: H₁ H₂ The test statistic, t, is The P-value is . (Round to two decimal places as needed.) (Round to three decimal places as needed.) State the conclusion for the test. OB. Ho: H₁ H₂ H₁: H₁ H₂ OD. Ho: H₁ = H₂ H₁: H1 H₂ O A. Fail to reject the null hypothesis. There is not sufficient evidence to warrant rejection of the claim that men and women have the same mean BMI. O B. Fail to reject the null hypothesis. There is sufficient evidence to warrant rejection of the claim that men and women have…arrow_forward
- An experiment was conducted to determine whether giving candy to dining parties resulted in greater tips. The mean tip percentages and standard deviations are given in the accompanying table along with the sample sizes. Assume that the two samples are independent simple random samples selected from normally distributed populations, and do not assume that the population standard deviations are equal. Complete parts (a) and (b). ... Question content area top right Part 1 μ n x s No candy μ1 36 18.61 1.39 Two candies μ2 36 21.26 2.34 * find the t stat * find the p value * State the conclusion * Construct a confidence interval suitable for testing the claim that the two samples are from populations with the same mean.arrow_forwardM. 山 Find the standardized test statistic, z, to test the claim that p, < P2. The sample statistics listed below are from independent samples. n = 550, x, = 121, and n, = 690, x, = 195 %3D O A. 1.116 O B. -2.132 OC. -2.513 O D. -0.985 P Type here to search 59 F5 F9 F11 %23 3. 5. 6. 8. A G H. B. N Altarrow_forwardListed below are systolic blood pressure measurements (mm Hg) taken from the right and left arms of the same woman. Assume that the paired sample data is a simple random sample and that the differences have a distribution that is approximately normal. Use a 0.01 significance level to test for a difference between the measurements from the two arms. Identify the test statistic and p-value. A. T = -4.01, p-value = 0.016 B. T = -3.07, p-value = 0.037 C. T = -2.32, p-value = 0.081 D. T = -1.93, p-value = 0.127arrow_forward
arrow_back_ios
SEE MORE QUESTIONS
arrow_forward_ios
Recommended textbooks for you
- MATLAB: An Introduction with ApplicationsStatisticsISBN:9781119256830Author:Amos GilatPublisher:John Wiley & Sons Inc
 Probability and Statistics for Engineering and th...StatisticsISBN:9781305251809Author:Jay L. DevorePublisher:Cengage Learning
 Statistics for The Behavioral Sciences (MindTap C...StatisticsISBN:9781305504912Author:Frederick J Gravetter, Larry B. WallnauPublisher:Cengage Learning
  Elementary Statistics: Picturing the World (7th E...StatisticsISBN:9780134683416Author:Ron Larson, Betsy FarberPublisher:PEARSON
 The Basic Practice of StatisticsStatisticsISBN:9781319042578Author:David S. Moore, William I. Notz, Michael A. FlignerPublisher:W. H. Freeman
 Introduction to the Practice of StatisticsStatisticsISBN:9781319013387Author:David S. Moore, George P. McCabe, Bruce A. CraigPublisher:W. H. Freeman
MATLAB: An Introduction with Applications
Statistics
ISBN:9781119256830
Author:Amos Gilat
Publisher:John Wiley & Sons Inc
Probability and Statistics for Engineering and th...
Statistics
ISBN:9781305251809
Author:Jay L. Devore
Publisher:Cengage Learning
Statistics for The Behavioral Sciences (MindTap C...
Statistics
ISBN:9781305504912
Author:Frederick J Gravetter, Larry B. Wallnau
Publisher:Cengage Learning
Elementary Statistics: Picturing the World (7th E...
Statistics
ISBN:9780134683416
Author:Ron Larson, Betsy Farber
Publisher:PEARSON
The Basic Practice of Statistics
Statistics
ISBN:9781319042578
Author:David S. Moore, William I. Notz, Michael A. Fligner
Publisher:W. H. Freeman
Introduction to the Practice of Statistics
Statistics
ISBN:9781319013387
Author:David S. Moore, George P. McCabe, Bruce A. Craig
Publisher:W. H. Freeman