
MATLAB: An Introduction with Applications
6th Edition
ISBN: 9781119256830
Author: Amos Gilat
Publisher: John Wiley & Sons Inc
expand_more
expand_more
format_list_bulleted
Related questions
Question
I need the test statistic and p value thankyou

Transcribed Image Text:**Transcription of Educational Image Text**
---
**Soda Weights Analysis**
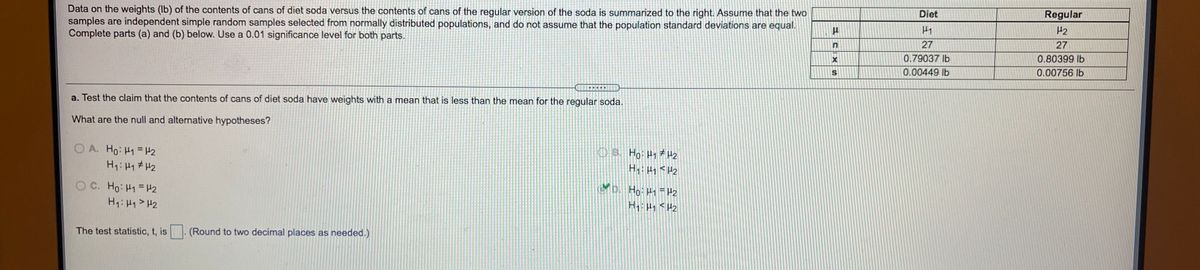
The data presented compares the weights (in pounds) of the contents of cans of diet soda to the contents of cans of the regular version of the soda.
The samples used are independent simple random samples selected from normally distributed populations. It's important to note that we do not assume the population standard deviations are equal. A significance level of 0.01 is used for both parts in this analysis.
---
**Provided Data Summary:**
| | Diet | Regular |
|------------|--------------|--------------|
| Population | \( \mu_1 \) | \( \mu_2 \) |
| n | 27 | 27 |
| \( \bar{x} \) | 0.79037 lb | 0.80399 lb |
| s | 0.00449 lb | 0.00756 lb |
---
**Hypothesis Test (Part a):**
We aim to test the claim that the contents of cans of diet soda have weights with a mean that is less than the mean for the regular soda.
**Null and Alternative Hypotheses:**
- **Option A:**
- \( H_0: \mu_1 = \mu_2 \)
- \( H_1: \mu_1 > \mu_2 \)
- **Option C:**
- \( H_0: \mu_1 = \mu_2 \)
- \( H_1: \mu_1 < \mu_2 \)
*Note*: Option C is selected as it aligns with the claim being tested.
---
**Statistical Calculation:**
The test statistic is denoted by \( t \), which should be rounded to two decimal places as required.
---
Expert Solution
This question has been solved!
Explore an expertly crafted, step-by-step solution for a thorough understanding of key concepts.

This is a popular solution

Trending nowThis is a popular solution!

Step by stepSolved in 3 steps with 3 images

Knowledge Booster

Similar questions
- You developed a way to measure anger people. Test the claim that the mean score of anger for younger people is equal to the mean score for older people. Use a significance level of .06. The scores are listed below. Scores for younger people: 25, 33, 19, 8, 39, 29, 28, 18, 41, 3, 27, 35, 14, 25, 36, 4, 11 Scores for older people: 38, 35, 21, 5, 19, 22, 35, 33, 54, 3, 55, 9, 15, 22, 47, 4, 21arrow_forwardtopic is Hypothesis test for proportions. I already answered most of the question. Please help me fill the rest. Thanksarrow_forwardHW10Q8 PLEASE FIND AND LABEL TEST STAT, P VALUE, AS WELL THANK YOU!arrow_forward
- cant figure out where im going wrong .arrow_forwardA medical researcher measures the increase in heart rate of patients who are taking a stress test. What kind of variable is the researcher studying? Choose the correct answer below. Identifier variable Ordinal variable Categorical variable Quantitative variablearrow_forwardA teacher claims that over 12% of maths students are married. In the suevey at the beginning of semester, 50 Students answered the question about their marital status. 12 of them said they were married. Calculate the test statistic Z (round answer to 2 decimala)arrow_forward
arrow_back_ios
arrow_forward_ios
Recommended textbooks for you
- MATLAB: An Introduction with ApplicationsStatisticsISBN:9781119256830Author:Amos GilatPublisher:John Wiley & Sons Inc
 Probability and Statistics for Engineering and th...StatisticsISBN:9781305251809Author:Jay L. DevorePublisher:Cengage Learning
 Statistics for The Behavioral Sciences (MindTap C...StatisticsISBN:9781305504912Author:Frederick J Gravetter, Larry B. WallnauPublisher:Cengage Learning
  Elementary Statistics: Picturing the World (7th E...StatisticsISBN:9780134683416Author:Ron Larson, Betsy FarberPublisher:PEARSON
 The Basic Practice of StatisticsStatisticsISBN:9781319042578Author:David S. Moore, William I. Notz, Michael A. FlignerPublisher:W. H. Freeman
 Introduction to the Practice of StatisticsStatisticsISBN:9781319013387Author:David S. Moore, George P. McCabe, Bruce A. CraigPublisher:W. H. Freeman
MATLAB: An Introduction with Applications
Statistics
ISBN:9781119256830
Author:Amos Gilat
Publisher:John Wiley & Sons Inc
Probability and Statistics for Engineering and th...
Statistics
ISBN:9781305251809
Author:Jay L. Devore
Publisher:Cengage Learning
Statistics for The Behavioral Sciences (MindTap C...
Statistics
ISBN:9781305504912
Author:Frederick J Gravetter, Larry B. Wallnau
Publisher:Cengage Learning
Elementary Statistics: Picturing the World (7th E...
Statistics
ISBN:9780134683416
Author:Ron Larson, Betsy Farber
Publisher:PEARSON
The Basic Practice of Statistics
Statistics
ISBN:9781319042578
Author:David S. Moore, William I. Notz, Michael A. Fligner
Publisher:W. H. Freeman
Introduction to the Practice of Statistics
Statistics
ISBN:9781319013387
Author:David S. Moore, George P. McCabe, Bruce A. Craig
Publisher:W. H. Freeman