Concept explainers
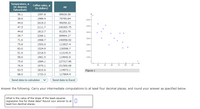
Managers of an outdoor coffee stand in Coast City are examing the relationship between (hot) coffee sales and daily temperature, hoping to be able to predict a day's total coffee sales from the maximum temperature that day. The bivariate data values for the coffee sales (denoted by y, in dollars) and the maximum temperature (denoted by x, in degrees Fahrenheit) for each of fifteen randomly selected days during the past year are given below. These data are plotted in the

Trending nowThis is a popular solution!
Step by stepSolved in 4 steps

- At a local supermarket, a group of taste-testers were asked to rate a new food product on a scale of 1 to 5, ranging from bad taste through excellent taste. Identify the most appropriate graph to describe the given data. histogram scatterplot bar graph stem-and-leaf plotarrow_forwardConsider the following data set *; | -1|2|3 Yi | 3 |2|1 and the model y = a, + a1¤ Calculate the squared error (SE) for the choice a, = 8 and a1 = -1 Answer:arrow_forwardResearchers Holdgate et al. (2016) studied walking behavior of elephants in North American zoos to see if there is a difference in average distance traveled by African and Asian elephants. They put GPS loggers on 33 African elephants and 23 Asian elephants and measured the distance (in kilometers) the elephants walked per day. The data in the file below Elephants contains results that are consistent with what the researchers found: Species Distance: African 6.12 African 3.65 African 4.26 African 3.8 African 5.23 African 5.02 African 5.17 African 5.37 African 4.89 African 6.4 African 6.42 African 6.85 African 3.38 African 7.71 African 4.02 African 3.52 African 5.81 African 5.83 African 7.02 African 6.11 African 4.62 African 5.54 African 3.2 African 5.49 African 5.47 African 6.97 African 3.74 African 3.04 African 7.84 African 8.62 African 7.63 African 5.25 African 4.19 Asian 1.39 Asian 2.59 Asian 8.03 Asian 7.93 Asian 0.33 Asian 8.22 Asian 6.95 Asian 2.39 Asian 3.89 Asian 10.53 Asian…arrow_forward
- Suppose the observational units in a study are the patients arriving at an emergency room on a given day, Nov 11, 2019. Number of patients that arrive before noon is a qualitative variable is a quantitative variable is not a variablearrow_forwardWhich of the following sets of data represent valid functions? OR = {(– 5,0), (2, 3), (6, 4), (8, 9), (15, 14)} OG = {(– 5, – 3), (2, 1), (2, 4), (8, 7), (15, 13)} OS = {(– 5, – 4), (2, 3), (6, 5), (7, 9), (11, 16)} OF = {(– 4, – 1), (3, 2), (5, 4), ( – 4, – 1), (10, 15)} - - Question Help: DVideoarrow_forwardThe data show the test results from students in two classrooms, one integrated and one not. There are two sets of test scores, a pre-test and a post-test for both groups. First, calculate a measure of change in the test scores for students in both groups. Then, use the resulting measure of change to compare both groups on the measure of change from the pre-test to the post-test. When finished, write a short summary of what you found, including: Group 1 mean Group 2 mean Ho and H1 t-observed t-criticalarrow_forward
- Part 2. Complete the following statements. A) The cumulative enrolment is the enrolment of the intervals smaller than the interval in question or equal to the latter. The graph of cumulative enrolment is represented by a function in B) The average, median and mode are three measures of of the C) The term refers to any data that deviates disproportionately from others. D) When the residual values are zero, then the correlation is calledarrow_forwardGn. Don't provide handwriting solutionarrow_forwardWhat are the most likely values of r for each plot of data shown below? Figure 1 *AT THE TOP r = -0.5 r = 0 r= 0.5 r = 1 ? Answer: Figure 2 *AT THE Bottom r = -0.5 r = 0 r= 0.5 r = 1 ? Answer:arrow_forward
 MATLAB: An Introduction with ApplicationsStatisticsISBN:9781119256830Author:Amos GilatPublisher:John Wiley & Sons Inc
 Probability and Statistics for Engineering and th...StatisticsISBN:9781305251809Author:Jay L. DevorePublisher:Cengage Learning
 Statistics for The Behavioral Sciences (MindTap C...StatisticsISBN:9781305504912Author:Frederick J Gravetter, Larry B. WallnauPublisher:Cengage Learning
 Elementary Statistics: Picturing the World (7th E...StatisticsISBN:9780134683416Author:Ron Larson, Betsy FarberPublisher:PEARSON
 The Basic Practice of StatisticsStatisticsISBN:9781319042578Author:David S. Moore, William I. Notz, Michael A. FlignerPublisher:W. H. Freeman
 Introduction to the Practice of StatisticsStatisticsISBN:9781319013387Author:David S. Moore, George P. McCabe, Bruce A. CraigPublisher:W. H. Freeman


