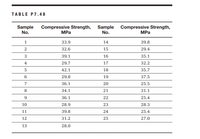
In a ready-mix plant, cylindrical samples are prepared and tested periodically to detect any mix problem and to ensure that the compressive strength is higher than the lower specification limit. The minimum target value was set at 27.6 MPa. The compressive strength data shown in Table P7.48 were collected. Use one system of units only as specified by the instructor.
a. Calculate the mean, standard deviation, and the coefficient of variation of the data.
b. Using a spreadsheet program, create a control chart for these data showing the target value and the lower specification limit. Is the plant production meeting the specification requirement? If not, comment on possible reasons. Comment on the data scatter.

Step by stepSolved in 4 steps with 1 images

- Solve it civil problemarrow_forwardRequired information For the concrete beam shown, the modulus of elasticity is 25 GPa for the concrete and 200 GPa for the steel. Take b=218 mm and d = 450 mm. Use an allowable stress of 12.5 MPa for the concrete and 140 MPa for the steel. NOTE: This is a multi-part question. Once an answer is submitted, you will be unable to return to this part. Using the area of steel calculated in part a, determine the largest allowable bending moment. The largest allowable bending moment is 96.06 kN-m.arrow_forwardA hot rolled steel tension test sample has a diameter of 6 mm and the original gage length of 30 mm. In a test to fracture, the stress and strain data below were obtained. Determine Generic Strain Value, %0.2 offset strain, and Calculated stress at %0.2 offset. Original diameter - 6mm Original Length - 30 mm Fracture diameter - 4.54 mmarrow_forward

 Structural Analysis (10th Edition)Civil EngineeringISBN:9780134610672Author:Russell C. HibbelerPublisher:PEARSON
 Principles of Foundation Engineering (MindTap Cou...Civil EngineeringISBN:9781337705028Author:Braja M. Das, Nagaratnam SivakuganPublisher:Cengage Learning
 Fundamentals of Structural AnalysisCivil EngineeringISBN:9780073398006Author:Kenneth M. Leet Emeritus, Chia-Ming Uang, Joel LanningPublisher:McGraw-Hill Education
 Traffic and Highway EngineeringCivil EngineeringISBN:9781305156241Author:Garber, Nicholas J.Publisher:Cengage Learning


