Structural Analysis
6th Edition
ISBN: 9781337630931
Author: KASSIMALI, Aslam.
Publisher: Cengage,
expand_more
expand_more
format_list_bulleted
Question
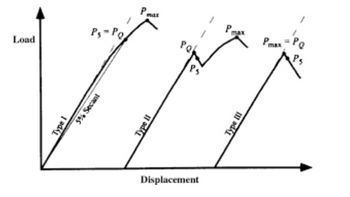
A compact tension specimen is tested according to ASTM standard E399. The load
displacement curve is shown in the Figure below with PQ= 120 kN (Type 1 curve). The specimen
dimensions are B=0.5 cm, W=10 cm, and “a” =5 cm. If the materials yield stress is 600 MPa are
the conditions correct for a valid K1C measurement?
Please look up McEviley’s textbook on the thickness criterion for a valid fracture toughness value.

Transcribed Image Text:The image depicts a graph comparing load versus displacement, featuring three types of loading behaviors labeled as Type I, Type II, and Type III.
1. **Axes**:
- The vertical axis represents "Load."
- The horizontal axis represents "Displacement."
2. **Type I**:
- Shows a linear increase in load with displacement until it reaches a point where \( P_s = PQ \).
- There is a marked point for "3% Secant."
3. **Type II**:
- Demonstrates an increase in load followed by a small drop at \( P_s \), then a rise to reach \( P_{\text{max}} \) and slight decline.
- It highlights the distinct points \( P_Q \) and \( P_s \).
4. **Type III**:
- The load increases with displacement without any initial drop, reaching \( P_{\text{max}} \). It ends with a rapid drop afterward.
- Here, \( P_{\text{max}} = PQ \), indicating a direct correlation between these two points.
This diagram is useful for understanding different structural response behaviors under varying loads and displacement conditions.
Expert Solution
This question has been solved!
Explore an expertly crafted, step-by-step solution for a thorough understanding of key concepts.
Step by stepSolved in 3 steps

Knowledge Booster
Learn more about
Need a deep-dive on the concept behind this application? Look no further. Learn more about this topic, civil-engineering and related others by exploring similar questions and additional content below.Similar questions
- A tension test is being conducted on a steel-rod specimen with a gauge length of L0=2 in and initial diameter of d0=0.5 in. Data were collected to form the conventional stress-strain diagram as shown. From the diagram, f = 74.0 ksi, e = 104.0 ksi , g = 85.0 ksi , and h = 0.15 in/in. Assuming that the strain remains constant throughout the region between the gauge points, determine the nominal strain ε experienced by the rod if it is elongated to L = 2.7 in . Assuming that the stress is constant over the cross-sectional area and if the tension force used is P = 11.0 kips, find the nominal stress experienced by the rod. Determine the force P needed to reach the ultimate stress in the steel-rod specimen.arrow_forwardA hot rolled steel tension test sample has a diameter of 6 mm and the original gage length of 30 mm. In a test to fracture, the stress and strain data below were obtained. Determine Generic Strain Value, %0.2 offset strain, and Calculated stress at %0.2 offset. Original diameter - 6mm Original Length - 30 mm Fracture diameter - 4.54 mmarrow_forward
Recommended textbooks for you

 Structural Analysis (10th Edition)Civil EngineeringISBN:9780134610672Author:Russell C. HibbelerPublisher:PEARSON
 Principles of Foundation Engineering (MindTap Cou...Civil EngineeringISBN:9781337705028Author:Braja M. Das, Nagaratnam SivakuganPublisher:Cengage Learning
 Fundamentals of Structural AnalysisCivil EngineeringISBN:9780073398006Author:Kenneth M. Leet Emeritus, Chia-Ming Uang, Joel LanningPublisher:McGraw-Hill Education
 Traffic and Highway EngineeringCivil EngineeringISBN:9781305156241Author:Garber, Nicholas J.Publisher:Cengage Learning


Structural Analysis (10th Edition)
Civil Engineering
ISBN:9780134610672
Author:Russell C. Hibbeler
Publisher:PEARSON

Principles of Foundation Engineering (MindTap Cou...
Civil Engineering
ISBN:9781337705028
Author:Braja M. Das, Nagaratnam Sivakugan
Publisher:Cengage Learning

Fundamentals of Structural Analysis
Civil Engineering
ISBN:9780073398006
Author:Kenneth M. Leet Emeritus, Chia-Ming Uang, Joel Lanning
Publisher:McGraw-Hill Education


Traffic and Highway Engineering
Civil Engineering
ISBN:9781305156241
Author:Garber, Nicholas J.
Publisher:Cengage Learning