
MATLAB: An Introduction with Applications
6th Edition
ISBN: 9781119256830
Author: Amos Gilat
Publisher: John Wiley & Sons Inc
expand_more
expand_more
format_list_bulleted
Related questions
Question
Calculate expected frequencies and formally test Goodness of fit. Use the sample mean. Are the plants random, clump, or repulsed in their distribution?
( must be typed into a MS Word document and must be performed manually not in statistical software )
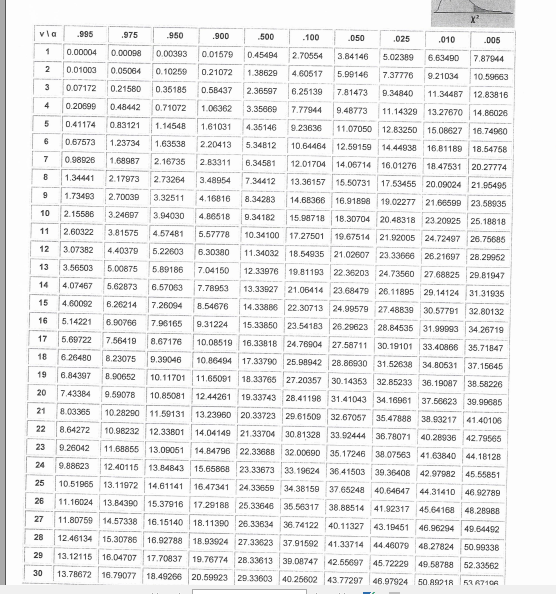

Transcribed Image Text:vla
.995
.975
950
.900
500
.100
.050
.025
.010
.005
1
0.00004
0.00008
0.00393
0.01579
0.45494
2.70554
3.84146
5.02389
6.63490
7.87944
2
0.01003
0.05064
0.10259
0.21072
1.38629
4.60517
5.90146
7.37776
9.21034
10.59663
3
0.07172
0.21580
0.35185
0.58437
2.36597
6.25139
7.81473
9.34840
11.34487 12.83816
4
0.20699
0.48442
0.71072
1.06362
3.35669
7.77944
9.48773
11.14329 13.27670 14.86026
5
0.41174
0.83121
1.14548
1.61031
4.35146
9.23636
11.07050 12.83250 15.08627 16.74960
6
0.67573
1.23734
1.63538
2.20413
5.34812
10.64464 12.59159 14.44938 16.81189 18.54758
7
0.98926
1.68987
2.16735
2.83311
12.01704 14.06714 16.01276 18.47531 20.27774
6.34581
8
1.34441
2.17973
2.73264
3.48954
7.34412
13.36157 15.50731 17.53455 20.09024 21.95495
9
1.73453
2.70039
3.32511
4.16816
8.34283
16.91898 19.02277 21.66599 23.58935
14.68366
10
2.15586
3.24697
3.94030
4.86518
9.34182
18.30704 20.48318 23.20925 25.18818
15.98718
11
2.60322
3.81575
4.57481
5.57778
10.34100 17.27501
19.67514 21.92005 24.72497 26.75685
12
3.07382
4.40379
5.22603
6.30380
11.34032 18.54935 21.02607 23.33666 26.21697 28.29952
13
3.56503
5.00875
5.89186
12.33976 19.81193 22.36203 24.73560 27.68825 29.81947
7.04150
14
4.07467
5.62873
6.57063
7.78953
13.33027 21.06414 23.68479 26.11895 29.14124 31.31935
15
4.60092
6.26214
7.26094
14.33886 22.30713 24.99579 27.48839 30.57791 32.80132
8.54676
16
5.14221
6.90766
7.96165
9.31224
15.33850 23.54183 26.29623 28.84535 31.99993 34.26719
17
5.69722
7.56419
8.67176
10.08519 16.33818 24.76904 27.58711 30.19101 33.40866 35.71847
18
6.26480
8.23075
9.39046
10.86494 17.33790 25.98942 28.86930 31.52638 34.80631 37.15645
19
6.84397
8.90652
10.11701 11.65091 18.33765 27.20357 30.14353 32.85233 36.19087 38.58226
20
7.43384
9.59078
10.85081 12.44261 19.33743 28.41198 31.41043 34.16961 37.56623 39.99685
21
8.03365
10.28290 11.59131 13.23960 20.33723 29.61500 32.67057 35.47888 38.93217 41.40106
22
8.64272
10.98232 12.33801 14.04149 21.33704 30.81328 33.92444 36.78071 40.28936 42.79565
23
9.26042
11.68855 13.OD051
14.84796 22.33688 32.00690 35.17246 38.07563 41.63840 44.18128
24
9.88623
12.40115 13.84843
15.65868 23.33673 33.19624 36.41503 39.36408 42.97982
45.55851
25
10.51965 13.11972 14.61141
16.47341 24.33659 34.38159 37.65248 40.64647 44.31410 46.92789
26
11.16024 13.B4390 15.37916 17.29188 25.33646 35.56317 38.88514 41.92317 45.64168 48.28988
27
11.80759 14.57338 16.15140 18.11390 26.33634 36.74122 40.11327 43.19451 46.96294 49.64492
28
12.46134 15.30786 16.92788 18.93924 27.33623 37.91592 41.33714 44.46079
48.27824 50.99338
29
13.12115 16.04707 17.70837 19.76774 28.33613 39.08747
42.55697 45.72229 49.58788 52.33562
30
13.78672 16.79077 18.49266 20.59923 29.33603 40.25602 43.77297 46.97924 50. AA218
53 R710A

Transcribed Image Text:TABLE 2.2 A Quantitative Frequency
Variable
Number of plants of the sedge Carex flacca found in 500 quadrats.
Observed
No. of plants
per quadrat
Y
frequency
181
118
97
3.
54
4
32
8.
Total
1
500
SOURCE: Data from Archibald (1950).
Expert Solution
This question has been solved!
Explore an expertly crafted, step-by-step solution for a thorough understanding of key concepts.

This is a popular solution

Trending nowThis is a popular solution!

Step by stepSolved in 2 steps

Knowledge Booster


Learn more about
Need a deep-dive on the concept behind this application? Look no further. Learn more about this topic, statistics and related others by exploring similar questions and additional content below.Similar questions
- Can you please do number 4,5 and 6arrow_forwardIncorrect An engineer designed a valve that will regulate water pressure on an automobile engine. The engineer designed the valve such that it would produce a mean pressure of 6.6 pounds/square inch. It is believed that the valve performs above the specifications. The valve was tested on 120 engines and the mean pressure was 6.8 pounds/square inch. Assume the variance is known to be 1.00. A level of significance of 0.05 will be used. Determine the decision rule. Enter the decision rule. Answer E Tables E Keypad How to enter your answer Keyboard Shortcuts Reject Ho if z> Tutor Skip Try Similar Submit Ansgr O 2020 Hawkes Learning MacBook Air 888 esc F1 #3 %23 & + 1 5 8 delete Q W R T Y U tab A S D G H K return caps lock C V B N M shift shift control option command command optionarrow_forwardWhich of the following is NOT a misuse of statistics?Choose the correct answer below.A.Utilizing valid statistical methods and correct sampling techniquesB.Concluding that a variable causes another variable because they have some correlationC.Misleading graphsD.Making conclusions about a population based on a voluntary response samplearrow_forward
- Weights (kg) of poplar trees were obtained from trees planted in a rich and moist region. The trees were given different treatments identified in the accompanying table. Use a 0.05 significance level to test the claim that the four treatment categories yield poplar trees with the same mean weight. Is there a treatment that appears to be most effective? LOADING... Click the icon to view the data table of the poplar weights. No Treatment Fertilizer Irrigation Fertilizer and Irrigation 1.24 0.99 0.09 0.93 0.65 0.94 0.63 1.41 0.41 0.55 0.13 1.06 0.15 0.51 0.88 1.49 1.31 1.01 0.84 Determine the null and alternative hypotheses. H0: ▼ mu 1 greater than mu 2 greater than mu 3 greater than mu 4μ1>μ2>μ3>μ4 Exactly two of the population means are equal.Exactly two of the population means are equal. Not all of the population means are equal.Not all of the population means…arrow_forwardFind the test statistic and p valuearrow_forwardPlease answer quickly!arrow_forward
- Scores in the first and final rounds for a sample of 20 golfers who competed in tournaments are contained in the Excel Online file below. Construct a spreadsheet to answer the following questions. Due to a recent change by Microsoft you will need to open the XLMiner Analysis ToolPak add-in manually from the home ribbon. Screenshot of ToolPak X Open spreadsheet Suppose you would like to determine if the mean score for the first round of an event is significantly different than the mean score for the final round. Does the pressure of playing in the final round cause scores to go up? Or does the increased player concentration cause scores to come down? a. Use a = .10 to test for a statistically significantly difference between the population means for first- and final-round scores. What is the p-value? p-value is What is your conclusion? There is no Final round (to 4 decimals) b. What is the point estimate of the difference between the two population means? (to 2 decimals) For which round…arrow_forwardWhat are the population parameters? Pick one: The difference in the sample sizes The difference in the two sample means The mean time spent for all test-takers before and after tutoring The mean time spent for all test-takers before and after tutoring combined Does sufficient or insufficient evidence exist?arrow_forwardSample(Prefers) 7. 6 5 3. 2. -1 -0.5 0 0.5 1.5 Sample(IAT-Weight-Score) A. Do the boxplots suggest that the samples come from populations with different means? Briefly explain.arrow_forward
arrow_back_ios
arrow_forward_ios
Recommended textbooks for you
- MATLAB: An Introduction with ApplicationsStatisticsISBN:9781119256830Author:Amos GilatPublisher:John Wiley & Sons Inc
 Probability and Statistics for Engineering and th...StatisticsISBN:9781305251809Author:Jay L. DevorePublisher:Cengage Learning
 Statistics for The Behavioral Sciences (MindTap C...StatisticsISBN:9781305504912Author:Frederick J Gravetter, Larry B. WallnauPublisher:Cengage Learning
  Elementary Statistics: Picturing the World (7th E...StatisticsISBN:9780134683416Author:Ron Larson, Betsy FarberPublisher:PEARSON
 The Basic Practice of StatisticsStatisticsISBN:9781319042578Author:David S. Moore, William I. Notz, Michael A. FlignerPublisher:W. H. Freeman
 Introduction to the Practice of StatisticsStatisticsISBN:9781319013387Author:David S. Moore, George P. McCabe, Bruce A. CraigPublisher:W. H. Freeman
MATLAB: An Introduction with Applications
Statistics
ISBN:9781119256830
Author:Amos Gilat
Publisher:John Wiley & Sons Inc
Probability and Statistics for Engineering and th...
Statistics
ISBN:9781305251809
Author:Jay L. Devore
Publisher:Cengage Learning
Statistics for The Behavioral Sciences (MindTap C...
Statistics
ISBN:9781305504912
Author:Frederick J Gravetter, Larry B. Wallnau
Publisher:Cengage Learning
Elementary Statistics: Picturing the World (7th E...
Statistics
ISBN:9780134683416
Author:Ron Larson, Betsy Farber
Publisher:PEARSON
The Basic Practice of Statistics
Statistics
ISBN:9781319042578
Author:David S. Moore, William I. Notz, Michael A. Fligner
Publisher:W. H. Freeman
Introduction to the Practice of Statistics
Statistics
ISBN:9781319013387
Author:David S. Moore, George P. McCabe, Bruce A. Craig
Publisher:W. H. Freeman