MATLAB: An Introduction with Applications
6th Edition
ISBN: 9781119256830
Author: Amos Gilat
Publisher: John Wiley & Sons Inc
expand_more
expand_more
format_list_bulleted
Question

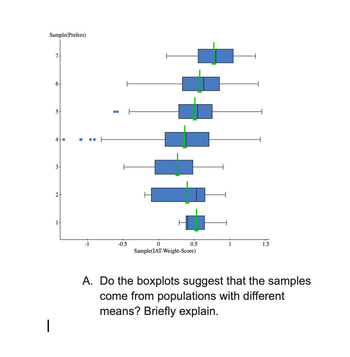
Transcribed Image Text:Sample(Prefers)
7.
6
5
3.
2.
-1
-0.5
0
0.5
1.5
Sample(IAT-Weight-Score)
A. Do the boxplots suggest that the samples
come from populations with different
means? Briefly explain.
SAVE
AI-Generated Solution
info
AI-generated content may present inaccurate or offensive content that does not represent bartleby’s views.
Unlock instant AI solutions
Tap the button
to generate a solution
to generate a solution
Click the button to generate
a solution
a solution
Knowledge Booster
Similar questions
- 20 computer screens were randomly selected from a large collection of computer screens in a company’s warehouse. These 20 computer screens are referred to as the: test statistic. parameter. population. sample.arrow_forward9 Below are the results of two polls of random samples of high school seniors and juniors, who were asked if they approve of, disapprove of, or do not care about a proposed ban of energy drinks on high school campuses. Poll I Poll II Approve Disapprove Do Not Care Total Seniors 10 30 60 100 a. Compare the proportions of seniors and juniors who approve, disapprove, and do not care in the two polls. EDIT CALC TESTS Interval.... 8: Interval.... 9:2 amPZInt.... 8:2-9PTInt..... A: 1-Pro B: 2-Prop nt...... DUX2-Test..... Int...... Juniors 12 32 56 100 For each poll, use your calculator or computer software to compute a tablof expected counts and x². 554 File Data Edit Craph Sta DOUAX De HVIS MITANTS D 5 4 7 te 24 Aprove ALDRIVE De Care Toul E Serc 40 :50 Date A Approve Disapprove Do Not Care Total Regression Linear Quadratic Cubic Quartic Power tom Tools Help Test domizat Distribution stribution of male... Exponential Logarithmic Seniors Juniors 100 120 300 320 600 560 1,000 1,000 Polynomial…arrow_forwardA repeated-measures ANOVA produces SSbetween treatments = 30 and MSbetween treatments = 10. In this analysis, how many treatment conditions are being compared? Group of answer choices -3 -4 -5 -20arrow_forward
- Which statistical analysis is needed to address this research question: H2: Men and women will differ in how rewarding they find their relationships. One sample t-test Two sample t-test ANOVA Paired sample t-testarrow_forwardUsing the following data, is there a significant difference in the population means? sample 1 sample 2 sample 3 3 4 2 2 3 0 4 5 2 3 2 1 2 5arrow_forwardAn unbiased sample is a good representation of the population. True or Falsearrow_forward
- If you have a study design that requires two different samples, what sort of test might you consider? Matched samples test Independent samples testarrow_forwardQ3.3 Normal, but why? A meal package for use at the space station is to be prepared by combining three separate components: protein, fruit/vegetable, and grains. Each of the components is to be randomly selected. Summary values for the caloric content for each of the components are given in the table. Component Protein (P) Fruit/vegetable (F) Grain (G) Mean (calories) 120 55 84 Stdv (calories) 6.4 Save Answer 1.0 3.6 Assume that the distributions of caloric content for each of the components are approximately normally distributed. Since the meal package consists of protein, fruit/vegetable, and grains, the total caloric content of a meal package is the random variable T, where T = P + F + G. Briefly explain why it is appropriate to say that T is approximately normally distributed. Q3.4 Probability Less than 275 Calories On your own piece of paper find the approximate probability that a randomly selected meal package will have less than 269 calories? (Draw an appropriate diagram, find a…arrow_forwardWhat is the comple solution and answer for this problem involving ANOVA?arrow_forward
arrow_back_ios
SEE MORE QUESTIONS
arrow_forward_ios
Recommended textbooks for you
 MATLAB: An Introduction with ApplicationsStatisticsISBN:9781119256830Author:Amos GilatPublisher:John Wiley & Sons Inc
 Probability and Statistics for Engineering and th...StatisticsISBN:9781305251809Author:Jay L. DevorePublisher:Cengage Learning
 Statistics for The Behavioral Sciences (MindTap C...StatisticsISBN:9781305504912Author:Frederick J Gravetter, Larry B. WallnauPublisher:Cengage Learning
 Elementary Statistics: Picturing the World (7th E...StatisticsISBN:9780134683416Author:Ron Larson, Betsy FarberPublisher:PEARSON
 The Basic Practice of StatisticsStatisticsISBN:9781319042578Author:David S. Moore, William I. Notz, Michael A. FlignerPublisher:W. H. Freeman
 Introduction to the Practice of StatisticsStatisticsISBN:9781319013387Author:David S. Moore, George P. McCabe, Bruce A. CraigPublisher:W. H. Freeman

MATLAB: An Introduction with Applications
Statistics
ISBN:9781119256830
Author:Amos Gilat
Publisher:John Wiley & Sons Inc

Probability and Statistics for Engineering and th...
Statistics
ISBN:9781305251809
Author:Jay L. Devore
Publisher:Cengage Learning

Statistics for The Behavioral Sciences (MindTap C...
Statistics
ISBN:9781305504912
Author:Frederick J Gravetter, Larry B. Wallnau
Publisher:Cengage Learning

Elementary Statistics: Picturing the World (7th E...
Statistics
ISBN:9780134683416
Author:Ron Larson, Betsy Farber
Publisher:PEARSON

The Basic Practice of Statistics
Statistics
ISBN:9781319042578
Author:David S. Moore, William I. Notz, Michael A. Fligner
Publisher:W. H. Freeman

Introduction to the Practice of Statistics
Statistics
ISBN:9781319013387
Author:David S. Moore, George P. McCabe, Bruce A. Craig
Publisher:W. H. Freeman