
MATLAB: An Introduction with Applications
6th Edition
ISBN: 9781119256830
Author: Amos Gilat
Publisher: John Wiley & Sons Inc
expand_more
expand_more
format_list_bulleted
Related questions
Question
thumb_up100%
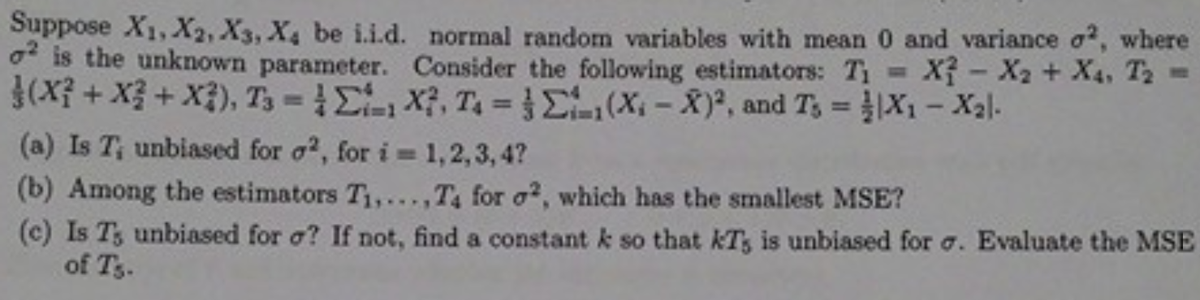
Suppose X1, X2, X3, X4 be i.i.d. normal random variables with mean 0 and variance sigma^2, where sigma^2 is the unknown parameter.
Consider the following estimators: T1 = X1 - X2 + X4, T2 = 1/3(X1 + X1 + X4), T3... T4... T5 = 1/2|X1 - X2|
(a) Is T1 unbiased for sigma^2, for i = 1,2,3,4
(b) Among the estimators T1,...,T4 for sigma^2, which has the smallest MSE?
(c) Is T5 unbiased for sigma? If not, find a constant k so that k*T5 is unbiased for sigma^2. Evaluate the MSE of T5.

Transcribed Image Text:Suppose X1, X2, X3, X4 be i.i.d. normal random variables with mean 0 and variance o?, where
o is the unknown parameter. Consider the following estimators: T1 X- X2 + X4, T2 =
3(X? + X3 + X3), T3 Ex, T L(X-X), and Ts X1- Xal.
%3D
(a) Is T, unbiased for o?, for i 1,2,3, 4?
(b) Among the estimators T,...,T4 for o?, which has the smallest MSE?
(c) Is T, unbiased for o? If not, find a constant k so that KT, is unbiased for o. Evaluate the MSE
of T3.
%D
Expert Solution
This question has been solved!
Explore an expertly crafted, step-by-step solution for a thorough understanding of key concepts.

Step by stepSolved in 4 steps

Knowledge Booster

Similar questions
- Please note the question is: What is the distribution of the t-test statistic if m, n -----> ∞ ?arrow_forwardSuppose we have two SRSS from two distinct populations and the samples are independent. We measure the same variable for both samples. Suppose both populations of the values of these variables are normally distributed but the means and standard deviations are unknown. For purposes of comparing the two means, we use (a) Two-sample t procedures (b) Matched pairs t procedures (c) z procedures (d) The least-squares regression line (e) None of the above. The answer isarrow_forwardthe standard normal distribution is just a normal distribution with μ = 0 and σ^2 = 1. it turns out that if we standardize a normal random variable X with parameters μ, σ in the following way z = x-μ/σ the expected value of the transformation is 0 and variance is 1. so if Z = 0.2, when μ=3 and σ= 0.2, what is the normal random variable X has value?arrow_forward
- Suppose X is a random variable with standard beta distribution and parameters (alpha) = 8 and (beta) = 2 What is (PX>=0.6)?arrow_forwardSuppose the time spent by a randomly selected student who uses a terminal connected to a local time-sharing computer facility has a gamma distribution with mean 12 min and variance 36 min². (a) What are the values of a and B? α = B = (b) What is the probability that a student uses the terminal for at most 18 min? (Round your answer to three decimal places.) (c) What is the probability that a student spends between 15 and 27 min using the terminal? (Round your answer to three decimal places.)arrow_forwardA study of blood samples of 64 men shows a mean count of 5million RBC per cubic ml., with a variance of 0.06. A tabulation of64 women from the same population group show a mean countof 4.5 million, with a variance of 0.13. What is the probability offinding a woman with a count of less than 5 million?arrow_forward
- If V1, V2, ... , Vn1 and W1, W2, ... , Wn2 are inde-pendent random samples of sizes n1 and n2 from normal populations with the means μ1 and μ2 and the common variance σ2, find maximum likelihood estima-tors for μ1,μ2, and σ2.arrow_forward5. Suppose the time spent by a randomly selected student at a campus computer laboratory has a gamma distribution with mean 20 min and variance 80 min². (a) What are the values of a and B? (b) What is the probability that a student spends between 20 and 40 min at the laboratory? (c) Only 1% of students will spend more than how many minutes at the laboratory?arrow_forwardSuppose a random sample of 25 students is selected from a community college where the scores on the final exam (out of 125 points) are normally distributed having mean equal to 112 and standard deviation equal to 4. Find the probability that the sample mean deviates from the population mean µ = 112 by no more than 3.arrow_forward
- Let X1, X2, X3, ..., X, be a random sample from a distribution with known variance Var(X,) = o², and unknown mean EX, = 0. Find a (1 – a) confidence interval for 0. Assume that n is large.arrow_forwardno. 2arrow_forwardA random sample of 10 subjects have weights with a standard deviation of 10.9654 kg what is the variance of their weights be sure to include the appropriate units with the resultarrow_forward
arrow_back_ios
SEE MORE QUESTIONS
arrow_forward_ios
Recommended textbooks for you
- MATLAB: An Introduction with ApplicationsStatisticsISBN:9781119256830Author:Amos GilatPublisher:John Wiley & Sons Inc
 Probability and Statistics for Engineering and th...StatisticsISBN:9781305251809Author:Jay L. DevorePublisher:Cengage Learning
 Statistics for The Behavioral Sciences (MindTap C...StatisticsISBN:9781305504912Author:Frederick J Gravetter, Larry B. WallnauPublisher:Cengage Learning
  Elementary Statistics: Picturing the World (7th E...StatisticsISBN:9780134683416Author:Ron Larson, Betsy FarberPublisher:PEARSON
 The Basic Practice of StatisticsStatisticsISBN:9781319042578Author:David S. Moore, William I. Notz, Michael A. FlignerPublisher:W. H. Freeman
 Introduction to the Practice of StatisticsStatisticsISBN:9781319013387Author:David S. Moore, George P. McCabe, Bruce A. CraigPublisher:W. H. Freeman
MATLAB: An Introduction with Applications
Statistics
ISBN:9781119256830
Author:Amos Gilat
Publisher:John Wiley & Sons Inc
Probability and Statistics for Engineering and th...
Statistics
ISBN:9781305251809
Author:Jay L. Devore
Publisher:Cengage Learning
Statistics for The Behavioral Sciences (MindTap C...
Statistics
ISBN:9781305504912
Author:Frederick J Gravetter, Larry B. Wallnau
Publisher:Cengage Learning
Elementary Statistics: Picturing the World (7th E...
Statistics
ISBN:9780134683416
Author:Ron Larson, Betsy Farber
Publisher:PEARSON
The Basic Practice of Statistics
Statistics
ISBN:9781319042578
Author:David S. Moore, William I. Notz, Michael A. Fligner
Publisher:W. H. Freeman
Introduction to the Practice of Statistics
Statistics
ISBN:9781319013387
Author:David S. Moore, George P. McCabe, Bruce A. Craig
Publisher:W. H. Freeman