
MATLAB: An Introduction with Applications
6th Edition
ISBN: 9781119256830
Author: Amos Gilat
Publisher: John Wiley & Sons Inc
expand_more
expand_more
format_list_bulleted
Related questions
Concept explainers
Topic Video
Question
Given this already solved problem, how could you determine whether homogeneity of variance is satisfied for this analysis, and be clear on how you decided this.
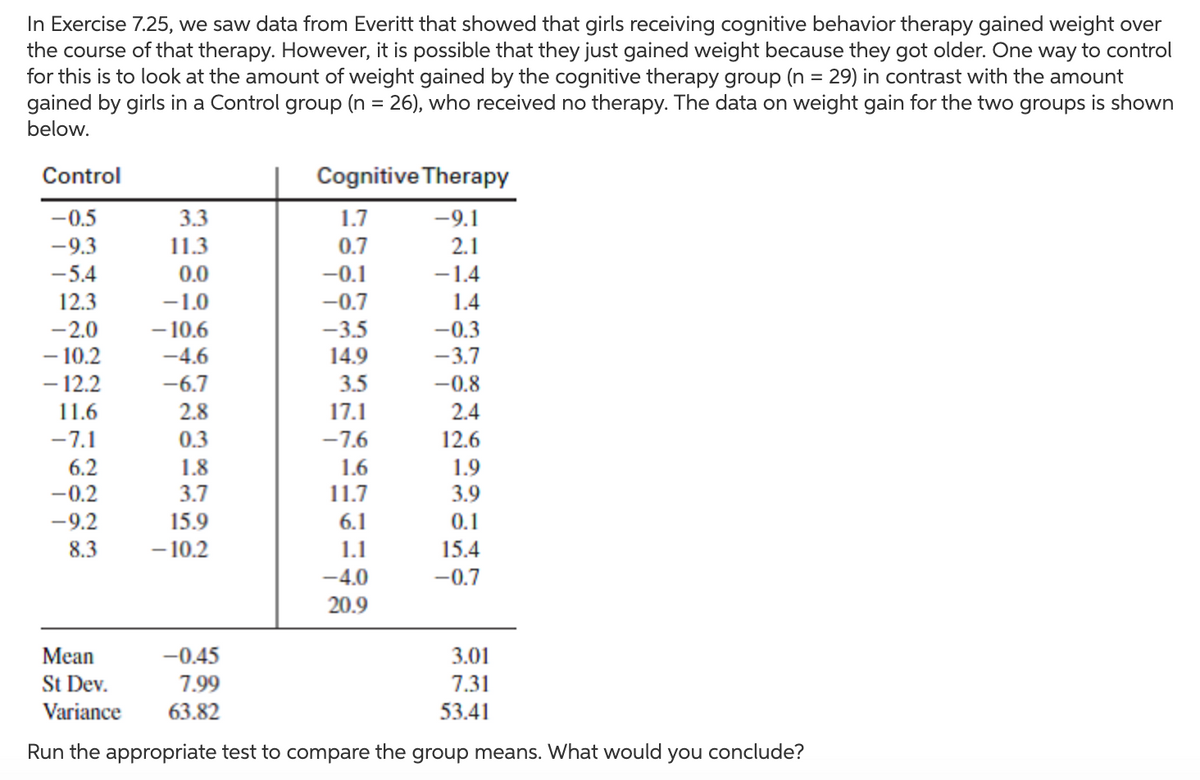

Transcribed Image Text:In Exercise 7.25, we saw data from Everitt that showed that girls receiving cognitive behavior therapy gained weight over
the course of that therapy. However, it is possible that they just gained weight because they got older. One way to control
for this is to look at the amount of weight gained by the cognitive therapy group (n = 29) in contrast with the amount
gained by girls in a Control group (n = 26), who received no therapy. The data on weight gain for the two groups is shown
below.
Control
Cognitive Therapy
-0.5
3.3
1.7
-9.1
-9.3
11.3
0.7
2.1
-5.4
0.0
-0.1
-1.4
12.3
-1.0
-0.7
1.4
-2.0
- 10.6
-3.5
-0.3
-3.7
- 10.2
- 12.2
-4.6
14.9
-6.7
3.5
-0.8
11.6
2.8
17.1
2.4
-7.1
0.3
-7.6
12.6
6.2
-0.2
1.8
1.6
1.9
3.7
11.7
3.9
-9.2
15.9
6.1
0.1
8.3
- 10.2
1.1
15.4
-4.0
-0.7
20.9
Мean
-0.45
3.01
St Dev.
7.99
7.31
Variance
63.82
53.41
Run the appropriate test to compare the group means. What would
you
conclude?

Transcribed Image Text:The t statistic is,
(+),
where, X= mean of first group
mean of second group
y
and combined variance,
(ns; + n3s;)
S* =
Step 2
We have,
Ho : Hs = Hy: mean of both group are not significantly different
> H: 'H
where H, = mean of girls receiving no therapy, i.e control
Hy = mean of girls receiving cognitive therapy
Step 3
From given,
I = -0. 45 y = 3.01
sI = 7.99 2 = 7.31
NI = 26
n2 = 29
Now the combined variance,
(26 * 7.99 + 29 * 7.3
26429-2
32094395
53
= 60. 5564
Step 4
The test statistic,
60.5564
= -1. 6462
As it is a left tailed test, and n, + 12 - 2 = 26 + 29 – 2 = 53 > 30,
hence t-Z-
The calculated t=-1.6462
The tabulated Z for left-tailed at 0.05 level of significance=-1.645
As
i.e - 1.646 < -1. 645
The
is rejected, and the mean weight of girls getting cognitive therapy is greater than the
Ho
mean weight of girls from control group.
Expert Solution
This question has been solved!
Explore an expertly crafted, step-by-step solution for a thorough understanding of key concepts.

Step by stepSolved in 2 steps

Knowledge Booster


Learn more about
Need a deep-dive on the concept behind this application? Look no further. Learn more about this topic, statistics and related others by exploring similar questions and additional content below.Similar questions
- A production engineer wants to determine if two assembly lines are producing the same mean number of units To test this: a sample of 10 days on line A reveals a mean of 110 units with a variance of 200 a sample of 15 days on line B reveals a mean of 100 units with a variance of 150. 1. Set up hypotheses and perform the appropriate test to resolve this question. Fully interpret your results.arrow_forwardPlease answer all the questions.arrow_forwardProfessor Hayashi has implemented a new book for his Fall 2013 statistics course. He wants to see if the new book has an effect on the exam average for Exam 3. He knows that the Exam 3 mean for all students who have taken his statistic course over the past 10 years is 77.2. He collects some data from a sample of 9 students and finds that the Exam 3 mean for his Fall 2013 statistics students is 81.7 with a variance of 32.49.Measure effect size using Cohen's D.arrow_forward
- an operation manager at an electronic company wants to test their amplifiers. the design engineer claims they have a mean output of 482 watts with a variance of 121. what is the propbability that the mean amplifier output would be greater than 479.4 watts in a sample of 59 amplifiers if the claim is true? round your asnwer to four decimal places.arrow_forwardYou may need to use the appropriate technology to answer this question. Three different methods for assembling a product were proposed by an industrial engineer. To investigate the number of units assembled correctly with each method, 36 employees were randomly selected and randomly assigned to the three proposed methods in such a way that each method was used by 12 workers. The number of units assembled correctly was recorded, and the analysis of variance procedure was applied to the resulting data set. The following results were obtained: SST = 12,620; SSTR = 4,520. (a) Set up the ANOVA table for this problem. (Round your values for MSE and F to two decimal places, and your p-value to four decimal places.) Sum Source of Variation Degrees Mean Square F of Squares of Freedom p-value Treatments Error Total (b) Use a = 0.05 to test for any significant difference in the means for the three assembly methods. State the null and alternative hypotheses. O Hg ² H₂ # H₂ # Hz H₂H₂ = H₂ = H₂ ⒸH₁…arrow_forwardAn analysis of variances produces dftotal = 35 and dfwithin = 32. For this analysis, what is dfbetween?arrow_forward
- A teacher is interested in assessing whether or not there is the same amount of variance in the scores of a particular type of test between male and female students. She believes that the variance for girls is higher than it is for boys. After grading the test she measures the following: In her class, 15 boys had a variance of 460 and 13 girls had a variance of 1,400. Set up hypotheses to test if the teacher’s assumption that the girls’ variance of scores on the test is higher than the boys’ variance. Perform the appropriate test and fully state your results.arrow_forwardHow are you able to get the standard variance from a TI-83 calculator?arrow_forwardThe next test is a t-test for unequal variance. Here is the problem: The human resources department at Sue, Grabitt, and Runne also tracks the cost of one-bedroom apartments in two popular neighborhoods, NoBo and SoBo. The general perception of long-time residents is that rents are probably lower in SoBo. They hope to determine whether the average rent for a one-bedroom apartment is lower in SoBo than in NoBo. The results of their survey are shown in Tables 18 and 19: Step 2. Select the Level of Significance, α A 5 percent significance has been selected. Step 3. State the Null Hypothesis (H0) and Alternate Hypothesis (H1) H0: H1: Step 4. Compose the Decision Rule Step 5. Calculate the Value of the Test Statistic, p-value, and estimate statistical power Use G*Power to calculate statistical powerarrow_forward
- Researchers at UT Austin noticed that the seagrass beds in Corpus Cristi Bay (CCB) were taller and thicker than those in Lower Laguna Madre (LLM). They compared the sediment ammonium concentration, in the two locations. Following are the summary statistics on sediment ammonium concentration, in micromoles, obtained by the researchers. Equality of variances is not assumed. CCB: X₁ 115.1, s₁= 79.4, n₁ = 51 LLM: X₂ = 24.3, S₂ 10.5, n₂: 19 = a. At the 1% significance level, is there sufficient evidence to conclude that the mean sediment ammonium concentration in CCB exceeds that in LLM? b. Determine a 98% confidence interval for the difference μ1-µ2, between the mean sediment ammonium concentrations in CCB and LLM. Interpret your answer in (a) in words. c. Do the results in (a) and (b) provide the consistent results? Explain.arrow_forwardSuppose that the City of Chicago is interested in potential revenues if they introduce a tolling station near O'Hare. Further suppose that the average time between cars is only 2.4 seconds; what is the variance of the distribution?arrow_forwardAn analysis of variances produces dftotal = 35 and dfwithin = 28. For this analysis, what is dfbetween? Round your answer to the nearest whole number.arrow_forward
arrow_back_ios
SEE MORE QUESTIONS
arrow_forward_ios
Recommended textbooks for you
- MATLAB: An Introduction with ApplicationsStatisticsISBN:9781119256830Author:Amos GilatPublisher:John Wiley & Sons Inc
 Probability and Statistics for Engineering and th...StatisticsISBN:9781305251809Author:Jay L. DevorePublisher:Cengage Learning
 Statistics for The Behavioral Sciences (MindTap C...StatisticsISBN:9781305504912Author:Frederick J Gravetter, Larry B. WallnauPublisher:Cengage Learning
  Elementary Statistics: Picturing the World (7th E...StatisticsISBN:9780134683416Author:Ron Larson, Betsy FarberPublisher:PEARSON
 The Basic Practice of StatisticsStatisticsISBN:9781319042578Author:David S. Moore, William I. Notz, Michael A. FlignerPublisher:W. H. Freeman
 Introduction to the Practice of StatisticsStatisticsISBN:9781319013387Author:David S. Moore, George P. McCabe, Bruce A. CraigPublisher:W. H. Freeman
MATLAB: An Introduction with Applications
Statistics
ISBN:9781119256830
Author:Amos Gilat
Publisher:John Wiley & Sons Inc
Probability and Statistics for Engineering and th...
Statistics
ISBN:9781305251809
Author:Jay L. Devore
Publisher:Cengage Learning
Statistics for The Behavioral Sciences (MindTap C...
Statistics
ISBN:9781305504912
Author:Frederick J Gravetter, Larry B. Wallnau
Publisher:Cengage Learning
Elementary Statistics: Picturing the World (7th E...
Statistics
ISBN:9780134683416
Author:Ron Larson, Betsy Farber
Publisher:PEARSON
The Basic Practice of Statistics
Statistics
ISBN:9781319042578
Author:David S. Moore, William I. Notz, Michael A. Fligner
Publisher:W. H. Freeman
Introduction to the Practice of Statistics
Statistics
ISBN:9781319013387
Author:David S. Moore, George P. McCabe, Bruce A. Craig
Publisher:W. H. Freeman