
MATLAB: An Introduction with Applications
6th Edition
ISBN: 9781119256830
Author: Amos Gilat
Publisher: John Wiley & Sons Inc
expand_more
expand_more
format_list_bulleted
Related questions
Concept explainers
Topic Video
Question
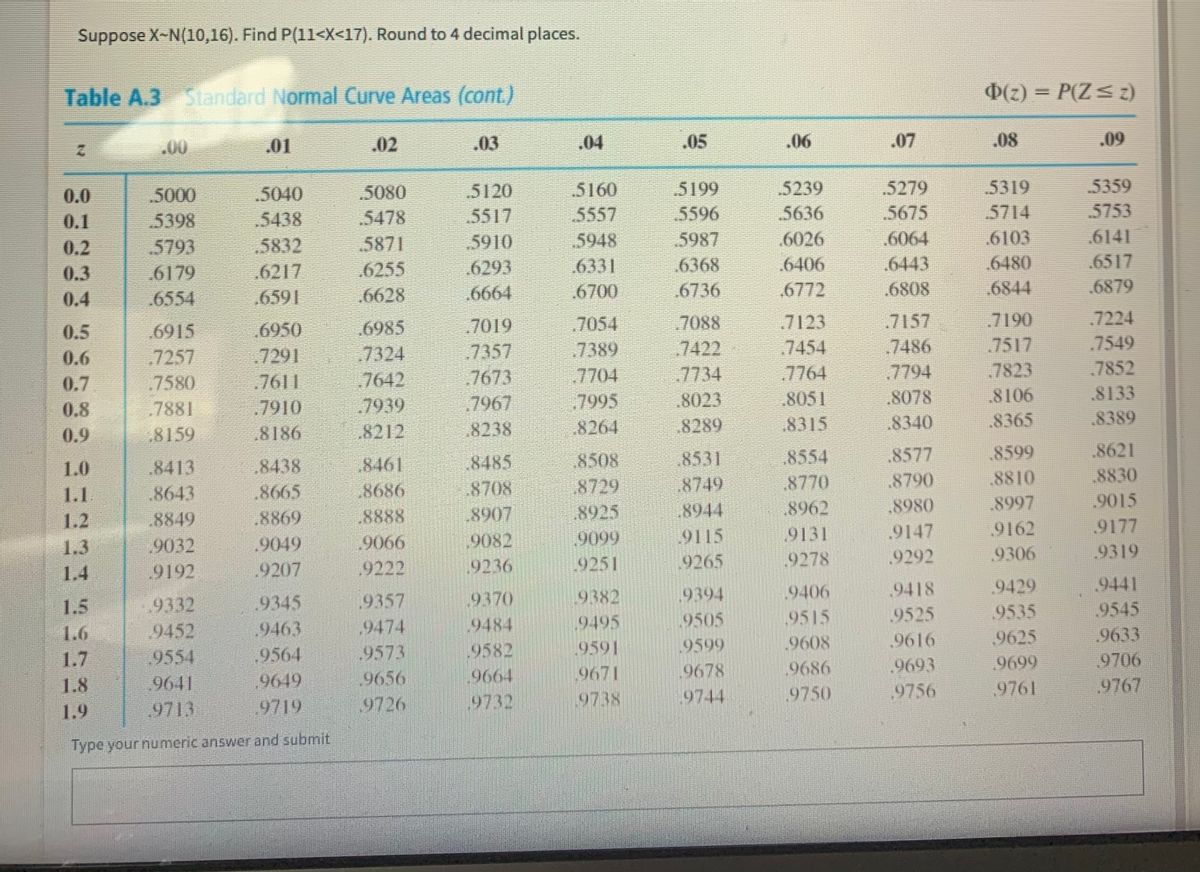

Transcribed Image Text:Suppose X-N(10,16). Find P(11<X<17). Round to 4 decimal places.
Table A.3 Standard Normal Curve Areas (cont.)
D(z) = P(Z< 2)
%3D
.00
.01
.02
.03
.04
.05
.06
.07
.08
.09
5359
5753
5319
.5279
5675
.5199
.5239
5120
5517
.5910
6293
.6664
.5160
.5040
5438
0.0
.5000
.5080
0.1
5398
.5478
5557
5596
5636
5714
5871
5948
5987
6026
6064
.6103
6141
.5793
6179
0.2
.5832
6443
6480
6517
6331
6700
0.3
6217
6255
.6368
.6406
6554
6591
6628
6736
6772
6808
.6844
6879
0.4
.7190
.7224
7157
7486
.7794
.7123
7054
7389
7704
7995
.6950
.6985
7019
7088
6915
.7257
.7580
0.5
.7517
.7549
7454
7764
8051
7422
7291
.7611
.7910
.8186
.7324
7642
.7939
.7357
7673
0.6
7734
.7823
.7852
0.7
7967
.8023
.8078
.8106
.8133
0.8
7881
8238
.8264
8289
.8315
.8340
.8365
8389
0.9
8159
8212
8577
8790
.8621
.8830
.8599
8531
8749
8554
8508
8729
8925
8485
8438
.8665
8461,
8686
1.0
8413
.8770
8810
1.1
.8643
.8708
.8962
.8980
.8997
.9015
1.2
.8849
.8869
.8888
.8907
9131
.9147
9162
9177
9115
9265
9082
9099
9066
.9222
1.3
.9032
.9049
9306
9319
9236
9251
9278
9292
1.4
9192
.9207
.9441
9545
.9633
9706
9418
9429
9394
9505
9599
9678
9357
.9370
9382
9406
.9345
9463
9564
9649
9719
9332
9452
1.5
9515
9525
9535
,9484
9582
.9474
.9495
1.6
9608
.9616
9625
1.7
9554
.9573
9591
9686
.9693
9699
9671
9656
9726
1.8
9641
9744
9750
9756
9761
9767
1.9
9713
9732
9738
Type your numeric answer and submit
Expert Solution
This question has been solved!
Explore an expertly crafted, step-by-step solution for a thorough understanding of key concepts.

This is a popular solution

Trending nowThis is a popular solution!

Step by stepSolved in 2 steps with 15 images

Knowledge Booster


Learn more about
Need a deep-dive on the concept behind this application? Look no further. Learn more about this topic, statistics and related others by exploring similar questions and additional content below.Similar questions
- Let x = red blood cell (RBC) count in millions per cubic millimeter of whole blood. Suppose for healthy females, x has an approximately normal distribution with mean μ=5 and standard deviation σ=0.6. Convert the following x interval from a laboratory test to a z interval. 4.4> x Group of answer choices –1> z 4> z 2> z 1< z 3< zarrow_forward12) A metal bar is heated, and then allowed to cool. Its temperature T (in °C) is found to be The time is in minutes. T=15+75e-0.25 t Find the time rate of change of temperature after 5.0 minutes. 13) The standard normal curve (sometimes called the bell curve) in statistics looks like: 1 -x² y = e 2 √2π Show that there are two inflection points at x = +1arrow_forwardWhat proportion of the nomal curve comesponds to (USING THE WHITEBOARD SHOW YOUR WORK WITH A SKETCH ***MAKE SURE TO SAVE YOUR IMAGE AND WRITE OUT THE PROPORTION O Anarrow_forward
arrow_back_ios
arrow_forward_ios
Recommended textbooks for you
- MATLAB: An Introduction with ApplicationsStatisticsISBN:9781119256830Author:Amos GilatPublisher:John Wiley & Sons Inc
 Probability and Statistics for Engineering and th...StatisticsISBN:9781305251809Author:Jay L. DevorePublisher:Cengage Learning
 Statistics for The Behavioral Sciences (MindTap C...StatisticsISBN:9781305504912Author:Frederick J Gravetter, Larry B. WallnauPublisher:Cengage Learning
  Elementary Statistics: Picturing the World (7th E...StatisticsISBN:9780134683416Author:Ron Larson, Betsy FarberPublisher:PEARSON
 The Basic Practice of StatisticsStatisticsISBN:9781319042578Author:David S. Moore, William I. Notz, Michael A. FlignerPublisher:W. H. Freeman
 Introduction to the Practice of StatisticsStatisticsISBN:9781319013387Author:David S. Moore, George P. McCabe, Bruce A. CraigPublisher:W. H. Freeman
MATLAB: An Introduction with Applications
Statistics
ISBN:9781119256830
Author:Amos Gilat
Publisher:John Wiley & Sons Inc
Probability and Statistics for Engineering and th...
Statistics
ISBN:9781305251809
Author:Jay L. Devore
Publisher:Cengage Learning
Statistics for The Behavioral Sciences (MindTap C...
Statistics
ISBN:9781305504912
Author:Frederick J Gravetter, Larry B. Wallnau
Publisher:Cengage Learning
Elementary Statistics: Picturing the World (7th E...
Statistics
ISBN:9780134683416
Author:Ron Larson, Betsy Farber
Publisher:PEARSON
The Basic Practice of Statistics
Statistics
ISBN:9781319042578
Author:David S. Moore, William I. Notz, Michael A. Fligner
Publisher:W. H. Freeman
Introduction to the Practice of Statistics
Statistics
ISBN:9781319013387
Author:David S. Moore, George P. McCabe, Bruce A. Craig
Publisher:W. H. Freeman